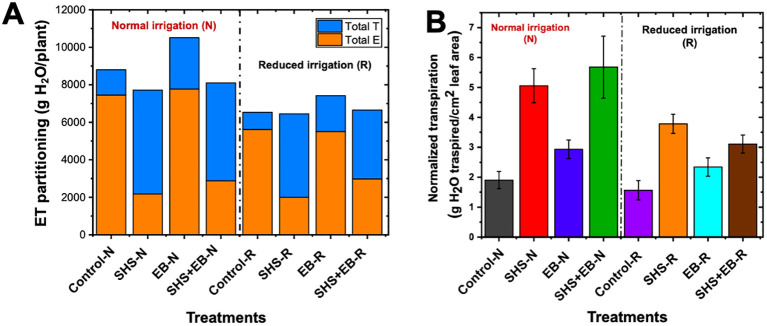
Figure 6.
Evapotranspiration (ET) partitioning in Moringa oleifera plants. E and T are total evaporation and transpiration per plant, respectively (A) for control soil, Superhydrophobic sand (SHS), engineered biochar (EB) and their combination (SHS+EB) under normal (N) and reduced irrigation (R). Total transpiration per plant was normalized per unit leaf area (LA) in each treatment (B). Each data point is a mean of five replicates (n = 5).

