Figure 1.
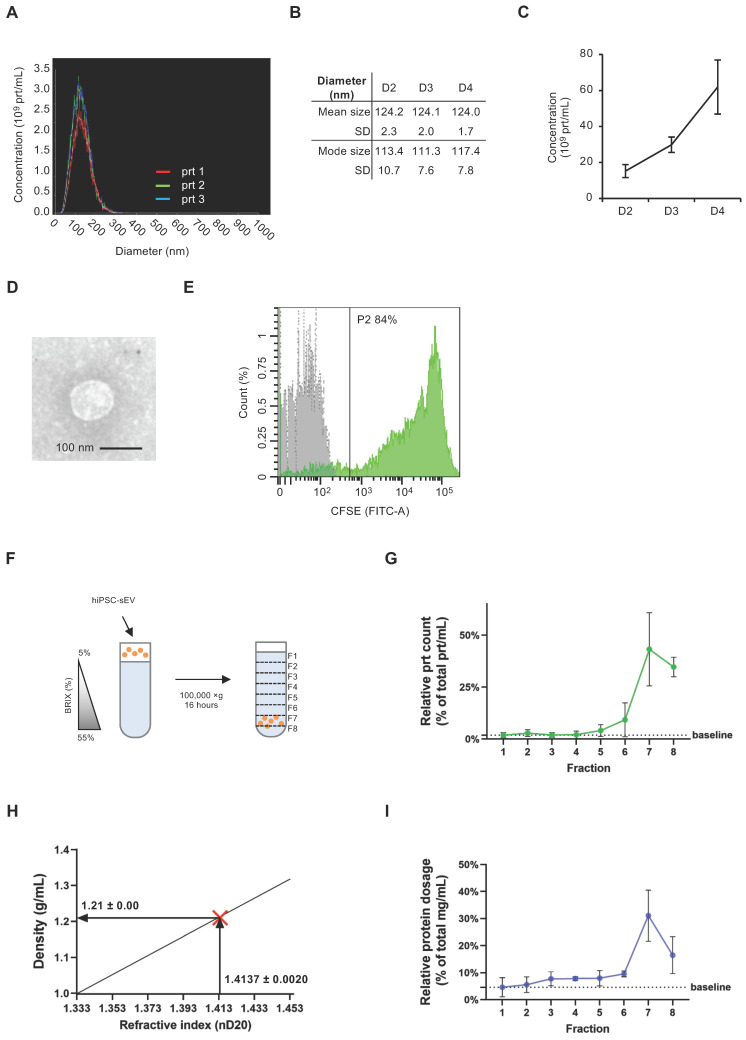
Human induced pluripotent stem cells release small extracellular vesicles. Overlayed histograms (A) show size distribution profile of particles released by hiPSC (n=3). Table (B) and scatter plot (C) represent mean, mode size and concentration of hiPSC particles (n=3) released during four days of culture (D2, D3, D4) as mean and standard deviation (SD). Representative TEM image (D) shows morphology and size of sEV released by hiPSC; scale bar is 100 nm. Histogram in (E) shows overlayed fluorescent signal from unlabeled (grey) and CFSE+ (green) hiPSC-sEV. Scheme (F) summarizes the protocol implemented for SDG separation of hiPSC-sEV. Plot in (G) reports the relative particle count calculated as percentage (%) of total prt/mL values for each fraction of the SDG; mean and SD are represented (n=3). Plot in (H) visually shows the estimation of hiPSC-sEV density starting from their refractive index, using the formula y=2.6564x-2.5421 (calculated based on standard conversion tables); hiPSC-sEV are indicated by the red X mark: vertical arrow pinpoints hiPSC-sEV refractive index, horizontal arrow pinpoints hiPSC-sEV density. Plot in (I) reports the relative protein dosage calculated as % of total protein concentration values for each fraction of the SDG; mean and SD are represented (n=3). Abbreviations: BRIX, sugar content of aqueous solution in percentage (%); D, days; F, fraction; hiPSC, human induced pluripotent stem cells; nD20, refractive index temperature compensated; P2, population 2 gate; prt, particles; SD, standard deviation; SDG, sucrose density gradient; TEM, transmission electron microscope; hiPSC-sEV, hiPSC-derived sEV.

