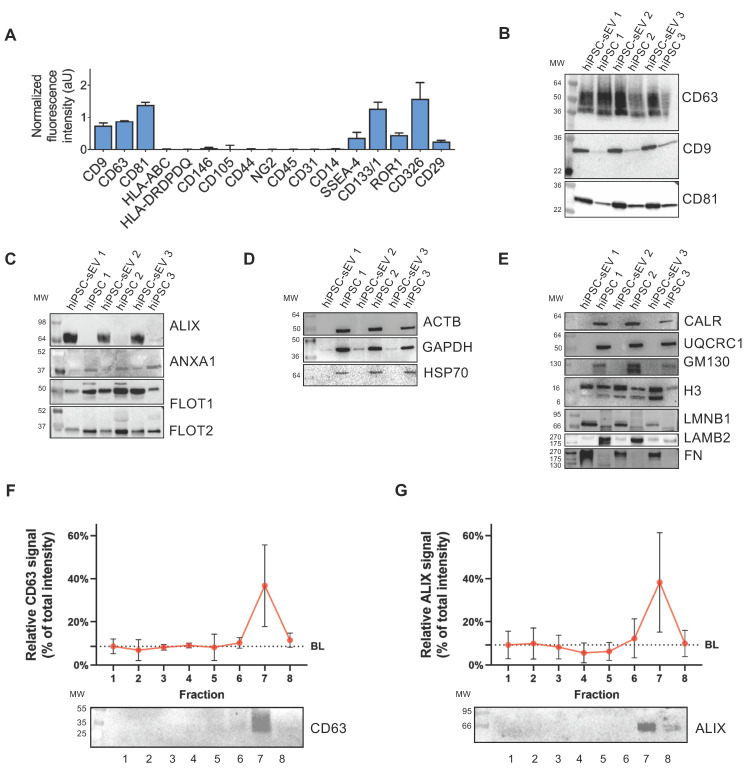
Figure 2.
hiPSC-derived extracellular vesicles are reminiscent of cell source and biogenesis pathway. Histograms in (A) show signal intensity determined by flow cytometry, in arbitrary units of protein markers on the surface of sEV released by hiPSC; mean and standard deviation (SD) are represented (n=3). Blots in (B-E) show western analysis comparisons between parental hiPSC and released hiPSC-sEV (n=3) for surface and luminal protein markers. In particular: EV surface non-cell-specific markers (B), cytosolic EV-specific (C) and non-EV-specific markers (D), other intracellular compartments markers (E). Image (F): upper panel shows signal intensity distribution of a sEV protein surface marker as detected by western analysis after separation by SDG (n=3; mean and SD are represented); lower panel is a representative blot. Image (G): upper panel shows signal intensity distribution of a sEV protein luminal marker as detected by western analysis after separation by SDG (n=3; mean and SD are represented); lower panel is a representative blot. Abbreviations: AU: arbitrary units; BL: baseline; hiPSC: human induced pluripotent stem cells; MW: molecular weight; SDG: sucrose density gradient; hiPSC-sEV: hiPSC-derived small extracellular vesicles.

