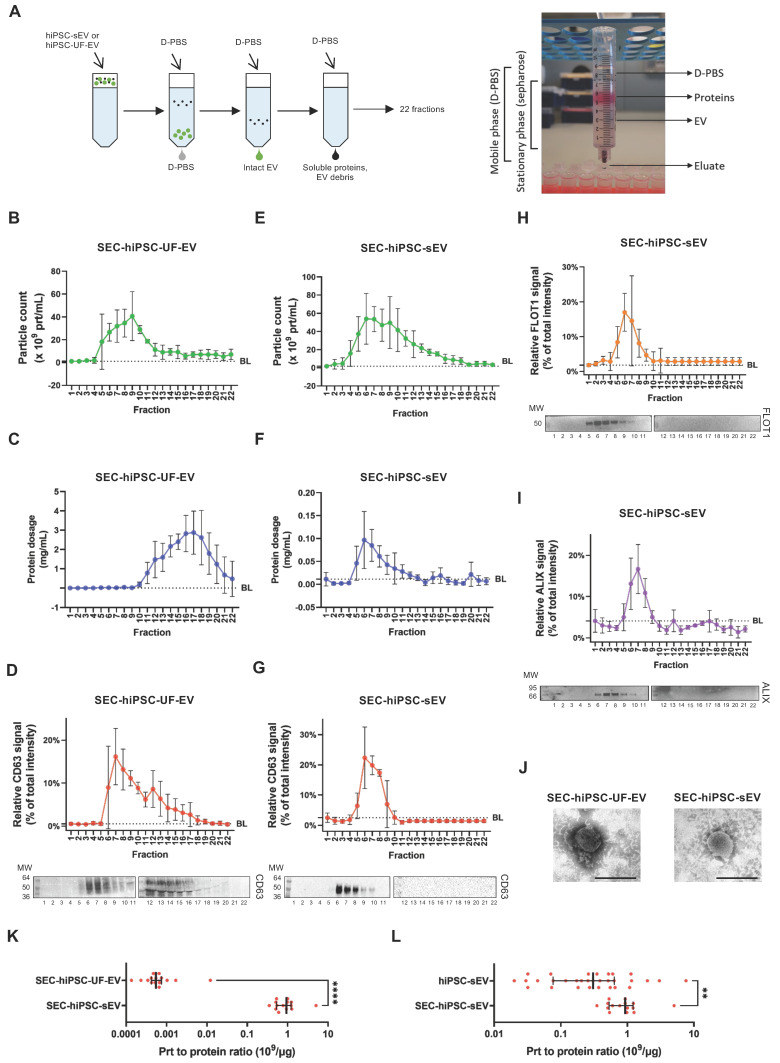
Figure 3.
Size-exclusion chromatography pinpoints integrity of pure hiPSC-derived extracellular vesicles. Scheme in (A) summarizes the protocol implemented for SEC together with a photo of the home-made SEC system implemented. Plots show distribution of particle count (B), protein dosage (C) and protein surface marker signal (D): upper panel for signal distribution; lower panel for representative blot) for a sample of hiPSC-UF-EV as detected by NTA after separation by SEC; mean and standard deviation (SD) are represented (n=3). Plots show distribution of particle count (E), protein dosage (F), protein surface (G) and luminal (H and I) marker signal (for (G), (H) and (I): upper panel for signal distribution; lower panel for representative blot) for a sample of hiPSC-sEV as detected by NTA after separation by SEC; mean and SD are represented (n=3). Representative TEM images (J) show morphology and size of SEC-hiPSC-UF-EV and SEC-hiPSC-sEV; scale bars are 200nm. Dot plot in (K) shows purity of SEC-hiPSC-UF-EV and SEC-hiPSC-sEV, evaluated as particles to protein ratio; median and interquartile range are represented (n=15 each); statistical analysis was by non-parametric Mann-Whitney test, ****p<0.0001. Dot plot (l) shows purity of hiPSC-sEV and SEC-hiPSC-sEV, evaluated as particles to protein ratio; median and interquartile range are represented (n=25 for hiPSC-sEV; n=15 for SEC-hiPSC-sEV); statistical analysis was by non-parametric Mann-Whitney test, **p<0.01. Abbreviations: BL: baseline; MW:molecular weight; NTA: nanoparticle tracking analysis; prt, particles: sEV, small extracellular vesicles; SEC:size-exclusion chromatography; TEM: transmission electron microscope; hiPSC-sEV: hiPSC-derived sEV; hiPSC-UF-EV: hiPSC-derived ultrafiltration-processed EV.

