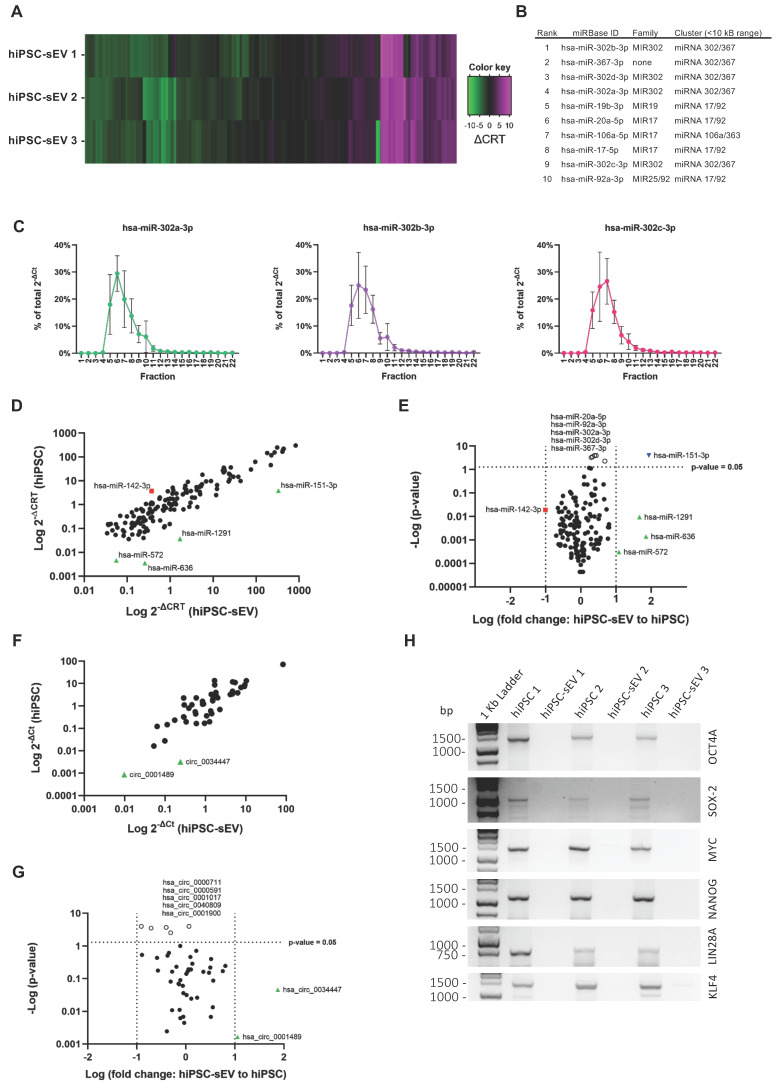
Figure 4.
hiPSC-derived extracellular vesicles shuttle a circRNA and stemness-associated miRNA cargo. Heatmap in (A) shows miRNome (n=3) of sEV released by hiPSC, reported as differential relative threshold values (∆CRT); differential incorporation into hiPSC-sEV is indicated by the color key. Table (B) lists hiPSC-sEV miRNome top ranked miRNA, indicating family and genomic cluster. Plots in (C) show relative abundance of selected top ranked miRNA for hiPSC-sEV samples, reported as percentage (%) of total 2-∆Ct values determined by qPCR after separation by SEC; mean and standard deviation (SD) are represented (n=3). Scatter plot in (D) shows the comparison between hiPSC (mean of n=3) and hiPSC-sEV (mean of n=3) miRNome in terms of differential expression reported as 2-∆CRT values determined by PCR-array (red square: miRNA underrepresented in hiPSC with a fold change > 1 Log; black dots: miRNA with fold changes within 1 Log; green triangles: miRNA overrepresented in hiPSC-sEV with a fold change > 1 Log). Volcano plot in (E) shows statistical significance of miRNome fold changes of hiPSC-sEV (mean of n=3) to hiPSC (mean of n=3) calculated from PCR-array 2-∆CRT values (red square: miRNA underrepresented in hiPSC with a fold change > 1 Log, but not statistically significant; black dots: miRNA with fold changes within 1 Log and not statistically significant; green triangles: miRNA overrepresented in hiPSC-sEV with a fold change > 1 Log, but not statistically significant; white dots: statistical significant miRNA, but with a fold change < 1 Log; blue inverted triangle: miRNA overrepresented in hiPSC-sEV with a fold change > 1 Log and statistically significant); statistical analysis was by Two-Way ANOVA followed by False Discovery Rate multiple comparisons post-hoc test. Scatter plot in (F) shows the comparison between hiPSC (mean of n=3) and hiPSC-sEV (mean of n=3) selected circRNA panel (n=46) in terms of differential expression reported as 2-∆Ct values determined by qPCR (black dots: circRNA with fold changes within 1 Log; green triangles: circRNA overrepresented in hiPSC-sEV with a fold change > 1 Log). Volcano plot in (G) shows statistical significance of circRNA fold changes of hiPSC-sEV (mean of n=3) to hiPSC (mean of n=3) calculated from qPCR 2-∆Ct values (black dots: circRNA with fold changes within 1 Log and not statistically significant; green triangles: circRNA overrepresented in hiPSC-sEV with a fold change > 1 Log, but not statistically significant; white dots: statistical significant circRNA, but with a fold change < 1 Log); statistical analysis was by Two-Way ANOVA followed by False Discovery Rate multiple comparisons post-hoc test. (H) Agarose gel showing comparison between parental hiPSC and hiPSC-sEV for the amplification of full-length mRNAs of OCT4, SOX2, MYC, NANOG, LIN28A and KLF4. Abbreviations: bp: base pairs; ∆CRT: differential relative threshold; hiPSC: human induced pluripotent stem cells; SEC: size-exclusion chromatography; hiPSC-sEV: hiPSC-derived small extracellular vesicles.

