Figure 1.
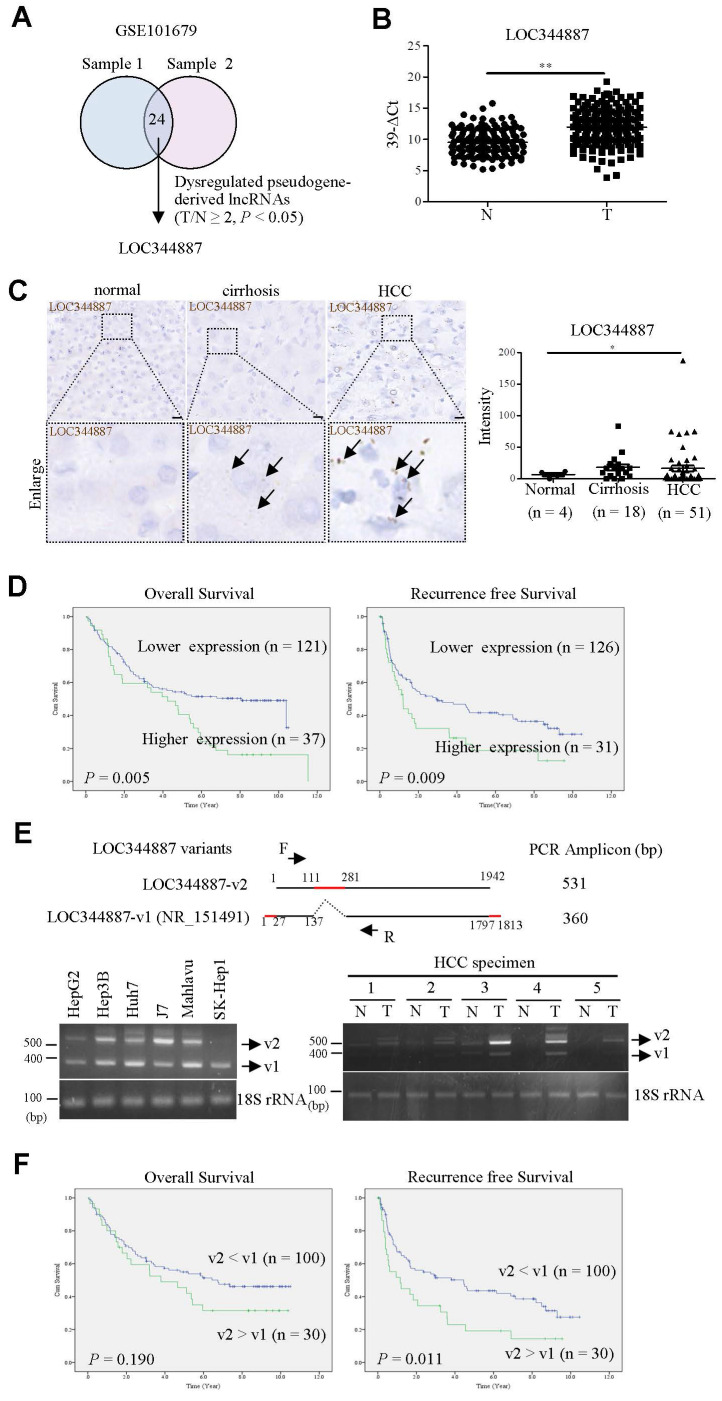
lncRNA LOC344887 is highly expressed in HCC and correlated to survival outcomes. (A) Venn diagram was utilized to illustrate significantly differentially expressed pseudogene-derived lncRNAs from two sets of paired HCC specimens containing tumor and adjacent normal tissues (GSE101679) 17. LOC344887 was the pseudogene-derived lncRNA most significantly upregulated in HCC tissues out of the total of 24 identified pseudogene-derived lncRNAs, which were differentially expressed by at least 2-fold in HCC as compared to adjacent normal tissues (P < 0.05). (B) Association of LOC34487 to tumor progression was determined by measuring the expression levels of LOC344887 in HCC tumors (n = 158) as compared to adjacent normal tissues (n = 158) using qRT-PCR. The results are presented as 39-∆Ct values. N: adjacent normal tissue; T: HCC tumors. Statistical significance was analyzed using the Mann-Whitney test. (C) LOC344887 expression was further validated by employing in situ hybridization (ISH) on tissue array. The brown signal (indicated by arrowhead) represents the intensity of LOC344887 signals (left panel), which were statistically quantified according to specimens grouped into normal (n = 4), cirrhotic (n = 18), and HCC tissues (n = 51) (right panel). Statistical significance was determined using one-way ANOVA followed by Tukey's post-hoc test. Scale bar, 100 μm. (D) Higher expression of LOC344887 was correlated to lower survival outcomes as determined by Kaplan-Meier log-rank analysis. Mean values of LOC344887 were used as the cutoff. (E) A schematic representation illustrates the two LOC344887 variants investigated in this study (upper panel), with the red line indicating the unique sequences for the v1 and v2 transcripts of LOC344887. RT-PCR primers (forward primer: F, reverse primer: R) were designed to specifically detect and distinguish the two LOC344887 transcripts (PCR amplicons for LOC344887-v1 and LOC344887-v2 were 360 bp and 531 bp, respectively). RT-PCR analysis was used to determine the expression of LOC344887 variants (v1 and v2) in six different hepatoma cell lines (lower left panel) and HCC specimens (lower right panel), showing varying expression levels for the two variants. 18S rRNA served as loading controls. The full-length sequences of LOC344887 transcripts are depicted in Supplementary Figure 1. (F) Correlation of the two LOC344887 variants to clinical OS and RFS was examined by RT-PCR analysis, which calculated fold-changes of LOC344887-v2 relative to LOC344887-v1 and categorized into higher expression group (expression level of LOC344887-v2 > LOC344887-v1) and lower expression group (expression level of LOC344887-v2 < LOC344887-v1). The survival outcomes in relation to LOC344887-v1 and v2 in these HCC specimens were then analyzed using the Kaplan-Meier log-rank analysis (*, P < 0.05; **, P < 0.01).

