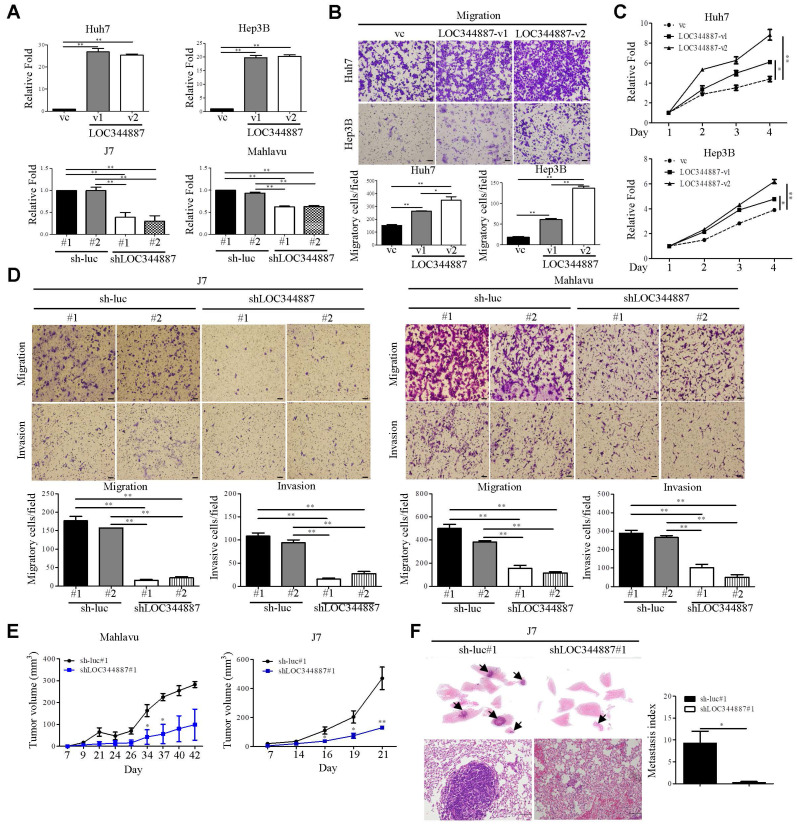
Figure 2.
LOC344887 expression is pertinent to cellular growth and cell motility of HCC in vitro and in vivo. (A) Two LOC344887 stable overexpression models (Huh7 and Hep3B) and stable knockdown models (J7 and Mahlavu) were established to assess the role of LOC344887 in HCC progression. Two LOC344887 variants and two shRNAs were employed in each HCC model. Expression levels of LOC344887 in these stable cell lines were determined via qRT-PCR analysis using 18S rRNA as the loading control. vc: vector control. (B) Cell migration assays were performed using stable cell lines, each overexpressing LOC344887 (LOC344887-v1 or LOC344887-v2). Migratory cells were stained with crystal violet, and cell counts were quantified using ImageJ software, showing significantly increased migration ability from cells overexpressing both variants. Scale bar, 100 μm. vc: vector control. (C) Cell growth of HCC impacted by LOC344887 was determined by monitoring cellular growth of LOC344887-overexpressing stable cell lines (LOC344887-v1 and LOC344887-v2) over 3 days the MTT assay. Data were normalized to values of viable cells on day 1 for each group and presented as fold changes. (D) Migration and invasion abilities of HCC cells impacted by LOC344887 knockdown were assessed using control cells (sh-luc#1 or sh-luc#2) and LOC344887-depleted cells (shLOC344887#1 or shLOC344887#2). Crystal violet-stained migratory and invasive cells were both significantly reduced upon LOC344887 knockdown. Scale bar: 100 μm. Statistical significances for in vitro assays were derived from one-way ANOVA followed by Tukey's post-hoc test. *, P < 0.05; **, P < 0.01. (E) The role of LOC344887 in in vivo tumor growth of HCC was evaluated using xenograft model by inoculating LOC344887 knockdown cells (shLOC344887#1) or control cells (sh-luc#1) subcutaneously into nude mice. (F) Hematoxylin and eosin (H&E) staining of lung tissues from J7-sh-luc and J7-shLOC344887#1 mice (n = 4 per group) was performed to uncover the inhibitory function of LOC34887 knockdown in metastasis. Metastases in lung tissues are indicated by arrowheads, and metastasis index was calculated from relative fold changes in number of metastasized cells. Scale bar, 50 μm. Statistical significances for in vivo experiments were obtained using the Mann-Whitney test. *, P < 0.05; **, P < 0.01.

