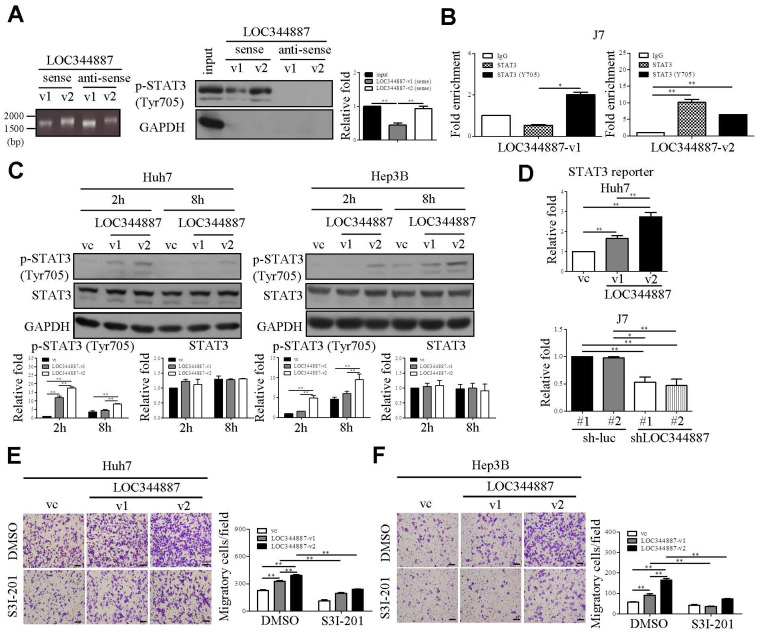
Figure 4.
LOC344887 interacts with STAT3 to promote phosphorylation of STAT3 and HCC migration. (A) The RNA pull-down assay using biotinylated LOC344887-v1 (sense) and LOC344887-v2 (sense) elicited interaction with endogenous pSTAT3 (Tyr705) as confirmed by western blot analysis, in which GAPDH was used as negative control (right panel). The quantitative results of p-STAT3 (n = 3) were normalized to the input for both sense strands of v1 and v2 transcripts. The integrity of the sense and antisense strands of LOC344887 transcripts was confirmed using RNA agarose gel electrophoresis (left panel). (B) RNA immunoprecipitation (RIP) assays using antibodies against STAT3 and p-STAT3 (Tyr705) were conducted to investigate physical association of LOC344887-v1 (v1) and LOC344887-v2 (v2) with STAT3 or phosphor-STAT3 in J7 cells, showing significantly enriched LOC344887-v1 and LOC344887-v2 in p-STAT3 (Tyr705) and STAT3 immunoprecipitates. Fold enrichment values were normalized to IgG. (C) At 2 and 8 hours post-transient transfection with vector control, LOC344887-v1 and LOC344887-v2 in Huh7 and Hep3B cell lines, p-STAT3 (Tyr705), STAT3 and GAPDH levels were assessed by western blot. The quantitative results of p-STAT3 or STAT3 (n = 3) were normalized to that of vc for both v1 and v2 transcripts, showing significant increases in p-STAT3 in cells overexpressing v1 and v2. (D) STAT3 luciferase reporter activity was assessed 48 hours after transfection into Huh7 LOC344887-overexpression or J7 LOC344887-knockdown stable cell lines, showing the ability of LOC344887 in enhancing or reducing p-STAT3 levels, respectively. Fold changes in reporter activities were calculated by normalizing to control groups (vc or sh-luc#1). Huh7 (E) and Hep3B (F) cells overexpressing LOC344887-v1 or LOC344887-v2 were treated with or without STAT3 inhibitor (S3I-201, 100 μM) to facilitate cell motility analysis, which showed specific inhibition in v1- and v2-induced motility. Scale bar: 100 μm. Statistical significances indicated in this figure were obtained from one-way ANOVA followed by Tukey's post-hoc test. *, P < 0.05; **, P < 0.01.

