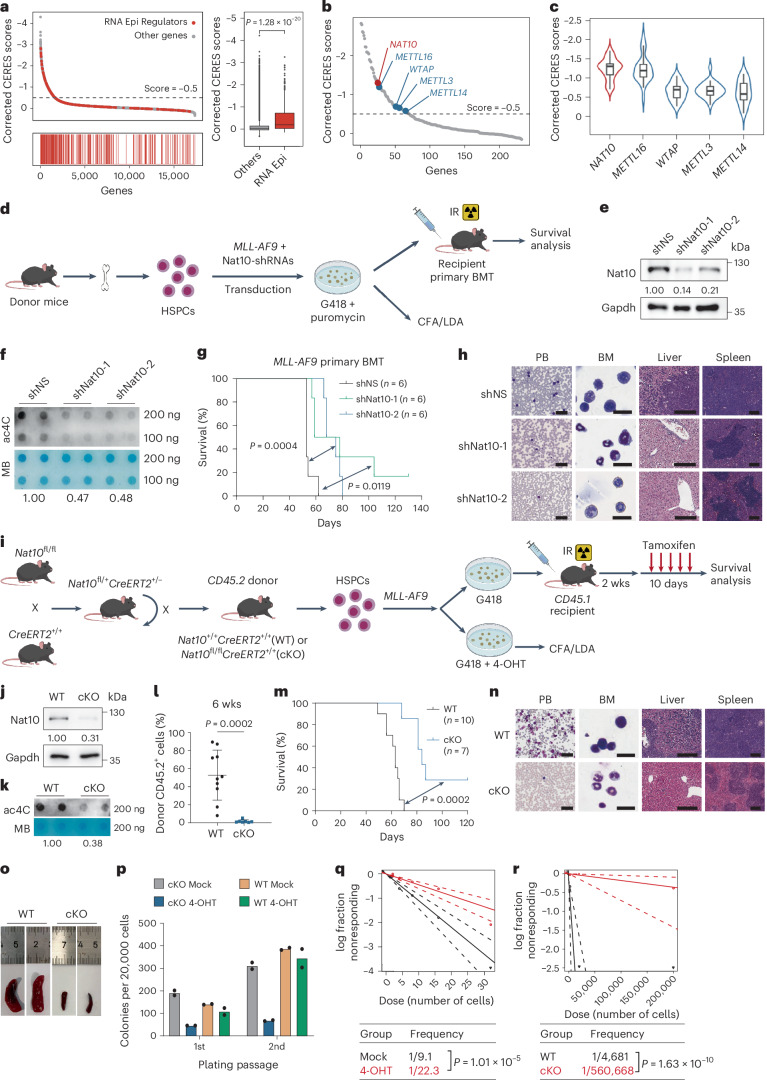
Fig. 1. Nat10 is essential for AML development and LSC/LIC self-renewal.
a, Corrected CERES scores of genes from genome-scale CRISPR-Cas9 essentiality screens across 24 human AML cell lines (left). CERES scores of RNA epigenetic regulators (n = 232) and other genes (n = 17,699) (right). Centre line, median; box limits, upper and lower quartiles; whiskers, 1.5 × interquartile range; points, outliers. b, Dot-plot of corrected CERES scores illustrating the top candidates of RNA epigenetic regulators. c, Violin plots showing the median and interquartile range of the CERES scores of NAT10 as well as m6A writers (n = 24). Centre line, median; box limits, upper and lower quartiles; whiskers, 1.5 × interquartile range. d, Experimental scheme of MLL-AF9-driven AML mouse model. IR, irradiation. e,f, Western blot analysis (e) and dot-blot analysis (f) showing the decrease of Nat10 protein and RNA ac4C modification in MLL-AF9 transformed mouse HSPCs by Nat10 shRNAs. MB, methylene blue. g,h, The effect of Nat10 knockdown on MLL-AF9-induced leukaemogenesis (n = 6). Kaplan–Meier curves are shown in g. Wright–Giemsa staining of PB and BM, and haematoxylin and eosin (H&E) staining of liver and spleen of recipient mice at the end point are shown in h. Scale bars, 50 μm for PB, 20 μm for BM, 200 μm for liver and 300 μm for spleen. i, Experimental scheme for generation of Nat10-cKO mice and MLL-AF9-driven Nat10-cKO AML model. j,k, Western blot analysis (j) and dot-blot analysis (k) showing the ablation of Nat10 and ac4C levels in the BM cells of WT and Nat10-cKO mice 10 days after in vivo tamoxifen treatment. l–o, The effect of Nat10 KO on MLL-AF9-induced de novo leukaemogenesis in lethally irradiated recipient mice (WT, n = 10; cKO, n = 7). Percentages of CD45.2+ donor cells in the PB 6 weeks after BMT are shown in l. Values are mean ± s.d. and a two-tailed Student’s t-test was used. Kaplan–Meier curves are shown in m. Wright–Giemsa staining of PB and BM, and H&E staining of liver and spleen of recipient mice at the end point are shown in n. Scale bars are the same as in h. Representative images of spleens are shown in o. p, Colony numbers of MLL-AF9-transduced HSPCs from Nat10+/+CreERT2 (WT) or Nat10fl/flCreERT2 (cKO) mice in methylcellulose medium. 4-hydroxytamoxifen (4-OHT, 1 μM) was added to induce Nat10 KO as in q. q, In vitro LDA using MLL-AF9-transduced HSPCs from WT or Nat10-cKO mice. r, In vivo LDA using BM leukaemia cells from primary BMT mice in m. Values are mean of n = 2 biological replicates in p. Two-sided chi-squared tests were used in q and r. A two-sided Mann–Whitney U-test was used in a. Log-rank tests were used in g and m. Generic Diagramming Platform (https://biogdp.com/) was used to draw schematic diagrams in d and i.

