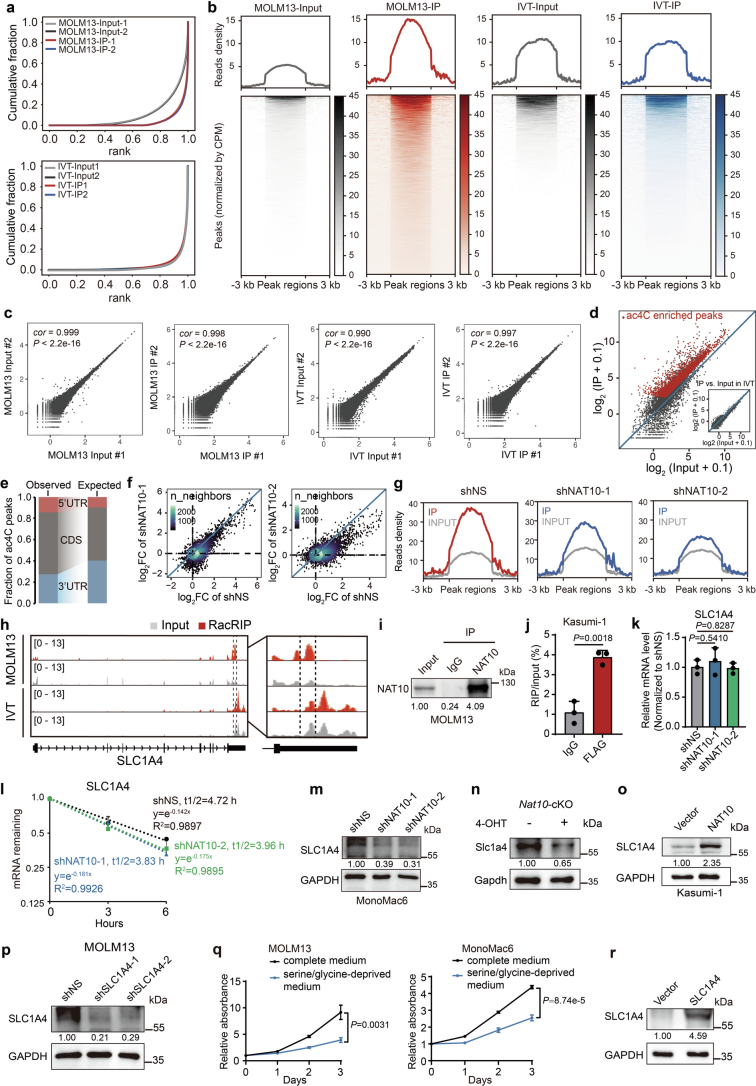
Extended Data Fig. 4. Transcriptome-wide mapping of ac4C reveals SLC1A4 as a direct target of NAT10.
(a) Cumulative distribution function (CDF) plot depicting the enrichment of ac4C signals in MOLM13 and IVT libraries. (b) The densities of ac4C signals in MOLM13 and IVT libraries. Regions with ac4C enrichment were sorted in descending order based on the mean value per region. (c) Correlation analysis of replicate libraries in RacRIP-seq. cor, Pearson's correlation coefficient. (d) Scatter plot showing high enrichment efficiency of reliable ac4C peaks (red) in MOLM13-IP but not IVT-IP. (e) The percentages of ac4C peaks within CDS or UTRs in the acetylated transcripts (observed) compared to the expected percentages based on the length of each region (expected). (f) Fold changes of ac4C peaks (IP/input) in NAT10 knockdown (sh1 or sh2) versus control (shNS) MOLM13 cells. (g) Enriched signals of ac4C modification in control (shNS) and NAT10 knockdown MOLM13 cells (sh1 and sh2). (h) IGV tracks showing the distribution of ac4C peaks in the full-length SLC1A4 mRNA transcript identified by RacRIP-seq in MOLM13 cells and IVT control (left). The region between two dashed lines depicted high-confidence ac4C region for acRIP–qPCR validation. The enlarged view around this region was shown (right). Y axis represents CPM (counts per million). (i) Western blotting showing that the endogenous NAT10 was effectively enriched in MOLM13 cells in the RIP assay. IP, immunoprecipitation. (j) The direct binding of NAT10 on SLC1A4 mRNA around high-confidence ac4C site was confirmed by RIP-qPCR assays using FLAG antibody in Kasumi-1 stable lines with ectopically expressed FLAG-NAT10. (k) The relative mRNA expression of SLC1A4 in MOLM13 cells on day 4 after NAT10 knockdown. (l) RNA stability assay showing the mRNA half-life (t1/2) of SLC1A4 in MOLM13 cells transduced with NAT10 shRNAs or shNS. Cells were treated with actinomycin D on day 4 after knockdown of NAT10. (m) Western blotting showing the decrease of SLC1A4 expression on day 4 after knockdown of NAT10 in MonoMac6 cells. (n) Western blotting showing the decrease of Slc1a4 expression in c-Kit+ BM cells from Nat10fl/flCreERT2 (cKO) mice treated with 4-OHT (1 μM) as compared to those treated with vehicle. Cells were collected from the 1st passage of CFA. (o) Western blotting showing the increase of SLC1A4 expression in Kasumi-1 stable lines with ectopic expression of SLC1A4. (p) Western blotting showing the knockdown efficiency of SLC1A4 in MOLM13 cells on day 4 post-transduction of lentiviral shRNAs. (q) MTT assays showing the growth of MOLM13 cells (left) and MonoMac6 cells (right) cultured in complete or serine/glycine-deprived medium. (r) Western blotting showing the overexpression of SLC1A4 in MOLM13 stable lines. Values are mean ± s.d. of n = 3 biological replicates in j, k, l and q. Two-tailed Student’s t-tests were used in j, k and q. Images in i, m, n, o, p and r were representative of three independent experiments.

