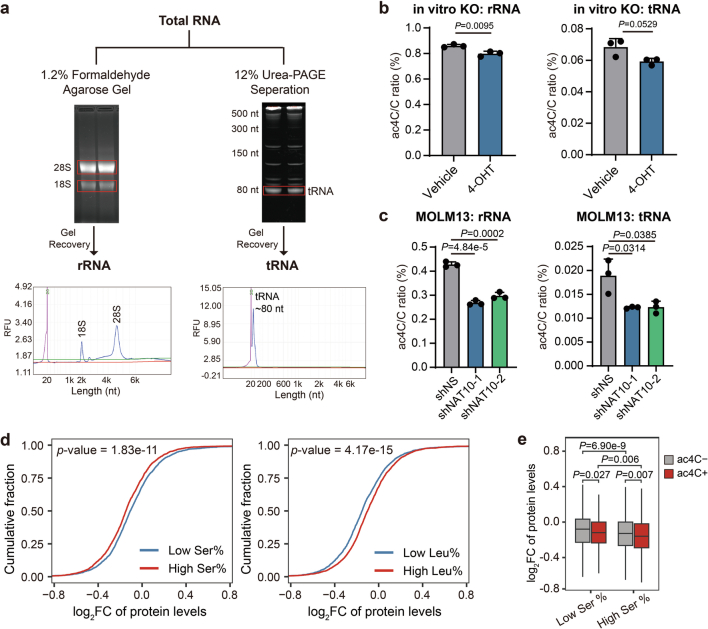
Extended Data Fig. 8. The ac4C modification on mRNAs plays a dominant role in the effect of NAT10 on AML cells.
(a) Schematic showing the isolation of rRNA and tRNA from total RNA and the purity validation of each fraction. (b) The ac4C levels in rRNA and tRNA in Nat10-cKO BM cells upon 4-OHT induction (1 μM for 72h) were detected by LC–MS/MS. (c) The ac4C levels in rRNA and tRNA in NAT10 knockdown and control MOLM13 cells on day 4 post-transduction were detected by LC–MS/MS. (d) Cumulative curves showing global changes of protein levels for proteins with high (greater than or equal to 7.5%) or low (lower than 7.5%) serine levels (left), or proteins with high (greater than or equal to 9.5%) or low (lower than 9.5%) leucine levels (right) in NAT10 knockdown (average of shNAT10-1/sh1 and shNAT10-2/sh2) versus control (shNS) MOLM13 cells. (e) Box plots showing global changes of protein levels for ac4C- or ac4C+ mRNAs with high (greater than or equal to 7.5%) or low (lower than 7.5%) serine levels in their protein products in NAT10 knockdown (average level of shNAT10-1 and shNAT10-2) versus control (shNS) MOLM13 cells. Box plot, center line, median; box limits, upper and lower quartiles; whiskers, 1.5 × interquartile range. Values are mean ± s.d. of n = 3 biological replicates in b and c. Two-tailed Student’s t-tests were used in b and c. Two-sided Mann–Whitney U-test was used in d and e.

