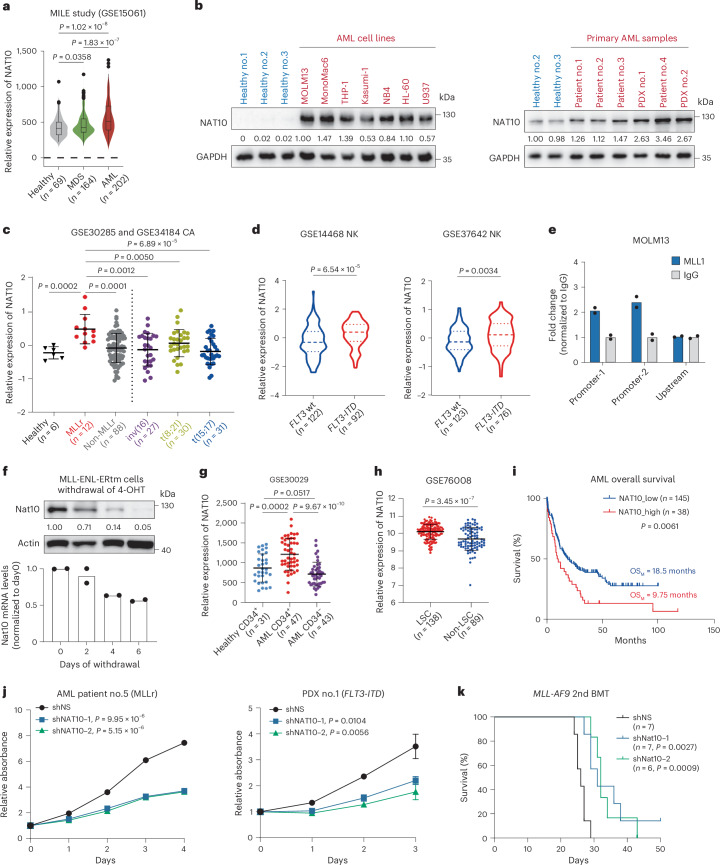
Fig. 6. NAT10 is highly expressed in AML and represents a therapeutic target.
a, NAT10 expression levels in BM-MNCs from primary MDS and patients with AML and healthy donors in the MILE study. Centre line, median; box limits, upper and lower quartiles; whiskers, 1.5 × interquartile range; points, outliers. b, Western blotting showing NAT10 protein levels in PBMCs from healthy control, human leukaemia cell lines and BM-MNCs from patients with AML. c, Microarray data showing NAT10 expression levels in patients with primary AML with chromosomal translocations and healthy donors. Values are mean ± s.d. MLLr, MLL-rearrangement. d, NAT10 expression levels in patients with normal-karyotype (NK) AML with WT FLT3 or FLT3-ITD mutation. Centre line, median; upper and lower lines, third and first quartiles. e, CUT&RUN assays showing the direct binding of MLL1/MLL1-fusion on NAT10 promoter. The upstream site served as a negative control. f, Western blotting (top) and RT–qPCR (bottom) showing a gradual decrease of Nat10 protein and mRNA levels in MLL-ENL-ERtm cells after 4-OHT withdrawal. g, NAT10 expression levels in CD34+ fractions from BM of healthy donors or patients with AML, as well as in CD34− fractions of BM from patients with AML. Values are mean ± s.d. h, NAT10 expression levels in functionally validated LSC and non-LSC fractions sorted from patients with primary AML. Values are mean ± s.d. i, Kaplan–Meier survival analysis of patients with AML based on their NAT10 expression levels from TCGA. OSM, medium overall survival. j, MTT assays showing the effects of NAT10 knockdown on cell proliferation of primary BM-MNC from a patient with MLL-rearranged AML (patient 5) and PDX cells harbouring FLT3-ITD mutation (PDX 1). k, Kaplan–Meier curves showing the effects of Nat10 knockdown on the maintenance/progression of MLL-AF9-induced AML in secondary BMT recipient mice. Values are mean of n = 2 biological replicates in e and f. Values are mean ± s.d. of n = 3 biological replicates and two-tailed Student’s t-tests were used in j. Log-rank tests were used in i and k. A two-sided Mann–Whitney U-test was used in a, c, d, g and h. Images in b are representative of three technical replicates.

