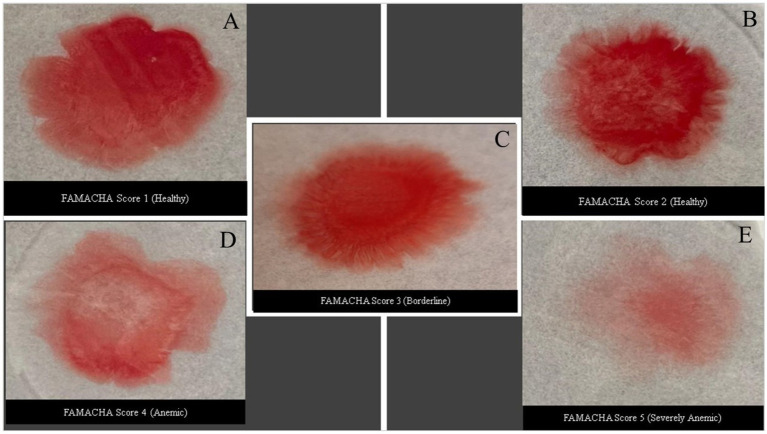
Figure 1.
Different blood patterns developed from a drop of blood (30 μL) 180 s after having been placed on glycerol-soaked filter paper after 180 s. Each image was correlated with PCV analysis values and its corresponding FAMACHA score. (A) PCV greater than 28%; (B) PCV range from 22 to 28%; (C) PCV range from 17 to 21%; (D) PCV range from 12 to 17%; and (E) PCV range less than 12%.

