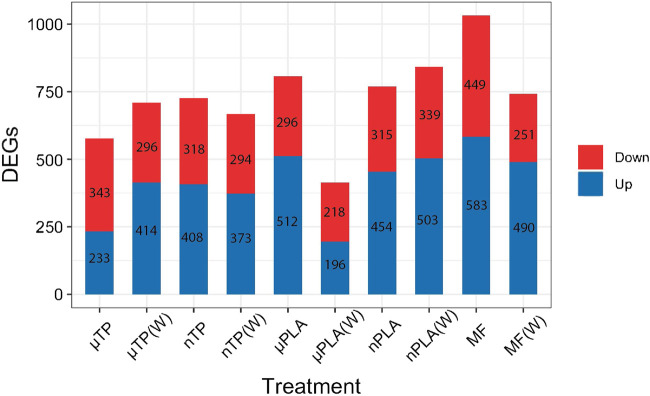
FIGURE 3.
Bar chart of the number of differentially expressed genes in Inland Silverside larvae following 21-day exposure to all MNP treatments. TP, tire particle (exposed at 50 p/mL); PLA, polylactic acid (exposed at 50 p/mL); MF, polyester microfiber (exposed at 30 p/mL). W, weathered; particles were weathered under UV A, B, and C light on a shaker at 15 PSU to simulate wave action. Downregulated genes are on top (red) and upregulated genes are on the bottom (blue).

