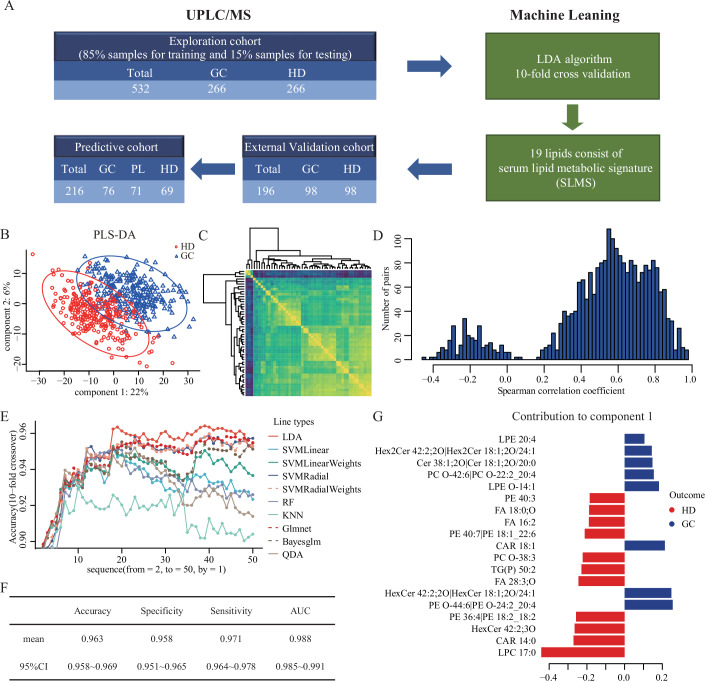
Figure 1. Construction of the serum lipid metabolic signature for GC diagnosis.
(A) Flow diagram for the construction and validation of SLMS. (B) Partial least squares-discriminant analysis of serum lipidomics between GC patients and healthy donors in the training cohort. (C) Heatmap for correlation analysis of the expression of the top 50 lipid metabolites. (D) Histogram of the distribution of spearman’s correlation coefficients between metabolites. (E) Accuracies of 10 classification algorithms when using different numbers of metabolites. (F) Results of 10-fold crossover validation of lipidomics data from the training cohort by using LDA and top 19 lipids. (G) The 19 lipids of SLMS and their contribution to component 1, ranking small to large. Bayesglm bayesian generalized linear models, GC gastric cancer, Glmnet lasso and elastic-net regularized generalized linear model, HD healthy donor, KNN k-nearest neighbor, LDA linear discrimination analysis, PL precancerous lesion, PLS-DA partial least squares-discriminant analysis, QDA quadratic discriminant analysis, RF random forest, SLMS serum lipid metabolic signature, SVMLinear linear support vector machine, SVMLinearWeights linear support vector machine with class weights, SVMRadial support vector machine with radial basis function, SVMRadialWeights support vector machine with radial basis function and class weights, UPLC/MS ultra-high performance liquid chromatography/mass spectrometry. Source data are available online for this figure.

