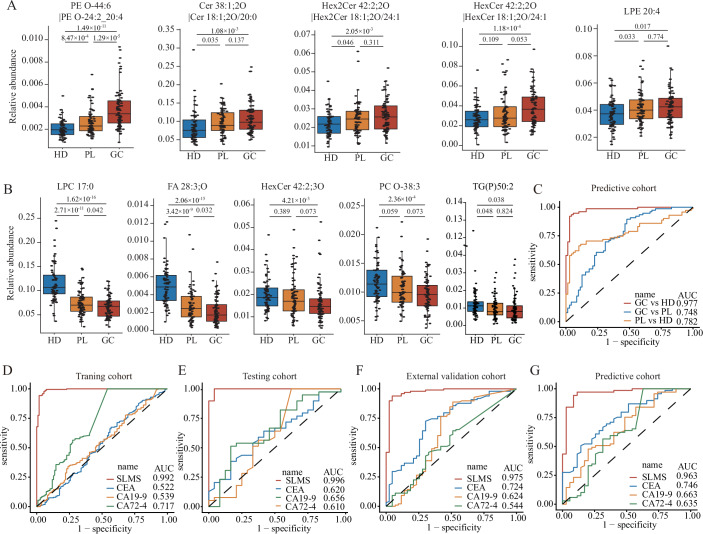
Figure 3. Application of the SLMS in the early detection of GC.
(A, B) The significantly downregulated (A) and upregulated (B) metabolites during the process from HD turning to PL and GC finally (Student’s t test). The numbers of the participants in HD, PL, and GC groups were 69, 71, and 76, respectively. (C) The ROC curves of SLMS in comparing any two groups in the predictive cohort. (D–G) The ROC curves of SLMS, CEA, CA19-9, and CA72-4 to differentiate GC patients in early-stage from healthy donors in the training (D), testing (E), external validation (F), and predictive cohorts (G). In the box plots of A and B, the upper bound, the line inside and the lower bound shows the 75th, 50th, and 25th percentiles of the sample while whiskers are extended to the most extreme data point that is no more than 1.5× interquartile range (75th percentile minus 25th percentile) from the edge of the box. AUC area under curve, CA19-9 carbohydrate antigen 199, CA72-4 carbohydrate antigen 724, CEA carcinoembryonic antigen, GC gastric cancer, HD healthy donor, PL precancerous lesion, ROC receiver operating characteristic, SLMS serum lipid metabolic signature.

