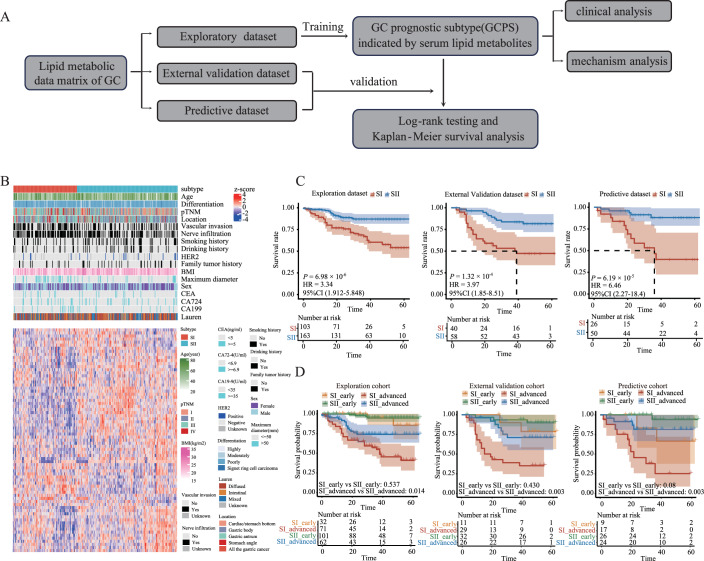
Figure 4. Serum lipid metabolites can predict the prognosis of GC.
(A) Workflow for the building and validation of GCPS. (B) Patient subgrouping based on the lipids associated with prognosis (P < 0.05 for univariable variant cox analysis and spearman’s correlation coefficients less than 0.5 between lipids). Samples and lipid metabolites are displayed as columns and rows, respectively, and the color of each cell shows the z-score of the relative abundance of the lipids (logarithmic scale in base 2). (C) Kaplan‒Meier curves for OS based on the GCPS for the exploration, external validation, and predictive cohorts. (D) Prognostic analysis of the GCPS in GC patients with different stages in the exploration, external validation, and predictive cohorts. P values were determined by log-rank test (C, D). CI confidence interval, GC gastric cancer, GCPS gastric cancer prognostic subtype, HR Hazard ratio, OS overall survival.

