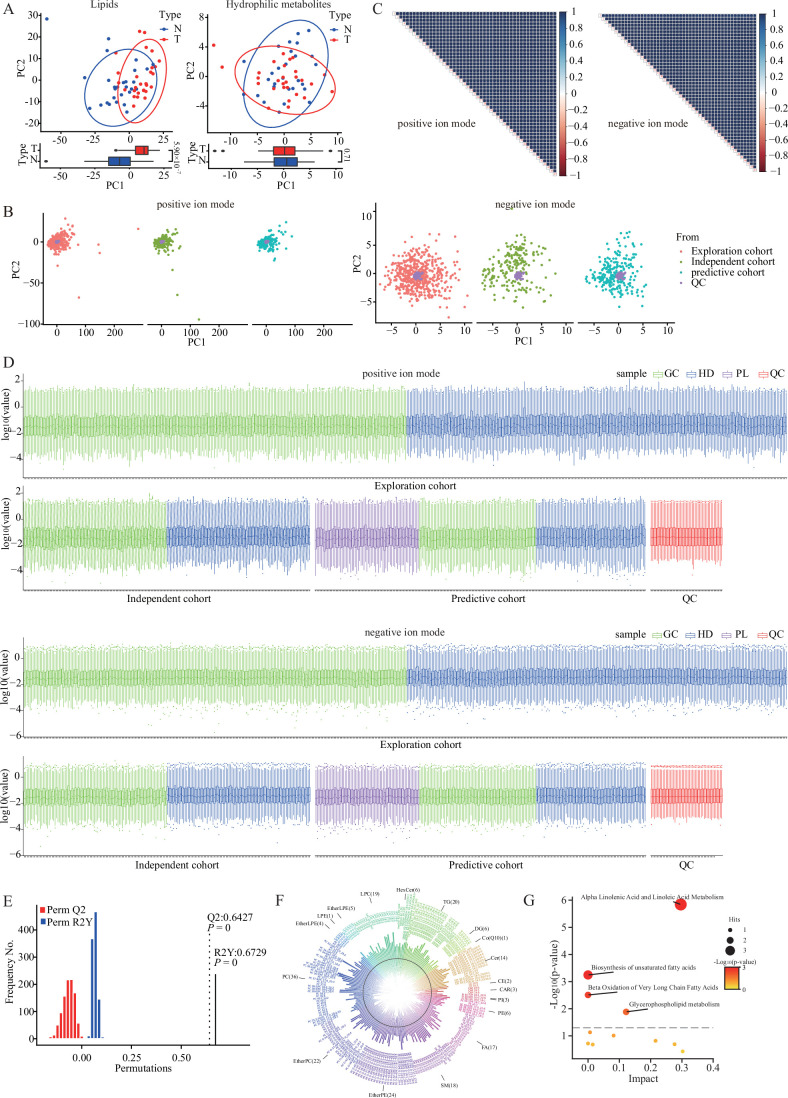
Figure EV1. The analysis of preliminary experiment data and quality control data.
(A) PCA on the lipid data or hydrophilic metabolite data of GC patients (n = 28) and healthy donors (n = 28). (B) PCA on the participant samples and QC samples showed that the QC samples were highly correlated. (C) Spearman’s correlation coefficients between QC runs, ranging from 0.97 to 1, demonstrated the high stability and reproducibility of data. (D) Intensity distribution of lipid species indicated that QC samples (n = 49) had good consistency with participant samples in quantification of serum lipid levels; The sample numbers of GC, HD, and PL groups have been shown in Fig. 1A. (E) The validity of the partial least squares-discriminant analysis in Fig. 1B showed no overfitting (permutation test, n = 1000). Q2 measures the predictive ability of the model, while R2Y measures the goodness of fit. (F) The significantly changed lipids between GC patients and healthy donors. The classes of lipids are displayed in different colors. The black circle indicates 0 of the lipid level and the height of the bar represents the normalized lipid levels. The direction of bars pointing towards and away from the center represents the lipid level of healthy donors and GC patients, respectively. (G) The pathway enriched by the significantly changed lipid in serums (Hypergeometric test). The definitions of box plots in (A) and (D) were consistent with those in Fig. 3A,B. PCA principal component analysis, PC principal component, QC quality control, GC gastric cancer, HD healthy donor, PL precancerous lesion.

