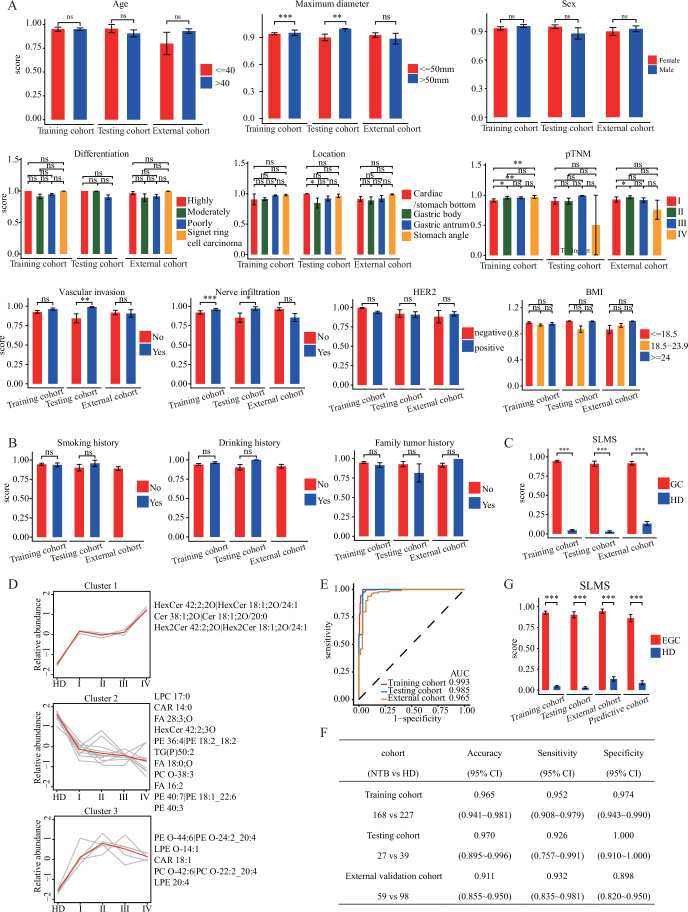
Figure EV2. The influence factor of the score of SLMS.
(A) The SLMS scores of GC patients were compared between different stratification of age, maximum diameter, sex, differentiation, location, pTNM, vascular invasion, nerve infiltration, HER2 and BMI in the training, testing and external validation cohorts. (B) The SLMS scores of GC patients were compared between different stratification of smoking history, drinking history and family tumor history in the training, testing, and external validation cohorts. (C) The difference between the SLMS score of GC patients and that of HDs in the training, testing, and external validation cohorts. (D) Mfuzz clustering of lipid trajectories during GC progression using 19 lipids according to the lipid changes’ similarity. Lipids in each cluster are presented on the side. HD, healthy donor. (E, F) The diagnostic performance of SLMS when used in detecting GC patients with negative CEA, CA19-9, and CA72-4. (G) The difference between the SLMS score of EGC patients and that of HDs in the training, testing, external validation, and predictive cohorts. P values were determined by Wilcox test and Data presented as the mean ± S.D. (A, B, C, G). CA19-9 carbohydrate antigen 199, CA72-4 carbohydrate antigen 724, CEA carcinoembryonic antigen, CI confidence interval, EGC early-stage gastric cancer, GC gastric cancer, HD healthy donor, NTB negative for three biomarkers, SLMS serum lipid metabolic signature, ns non-significant; ***P < 0.001; **P < 0.01; *P < 0.05. Source data are available online for this figure.

