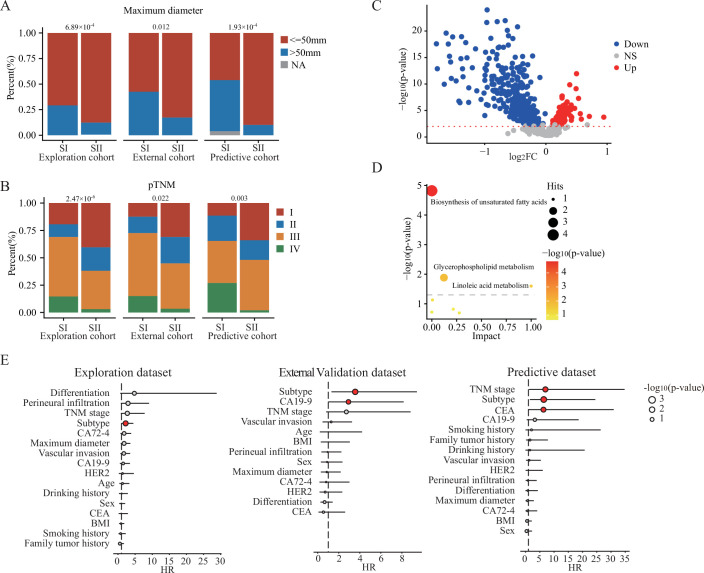
Figure EV3. Characterization of GCPS.
(A) The overlap between GCPS and maximum diameter. (B) The overlap between GCPS and pTNM stage. (C) Volcano plot comparing different lipids between SI and SII. (D) Enrichment analysis of different lipids between SI and SII. Hits are indicated by the size of the circle and significance is indicated by the color of the circle. (E) Multivariate Cox proportional hazards analyses of OS in patients with gastric cancer in three cohorts. The circles in red color indicated the P value was less than 0.05. P values were determined by Chi-square test (A, B), Wilcox test (C), Hypergeometric test (D), and Wald test (E). GCPS gastric cancer prognostic subtype, NS non-significant, OS overall survival, pTNM pathological Tumor-Node-Metastasis.

