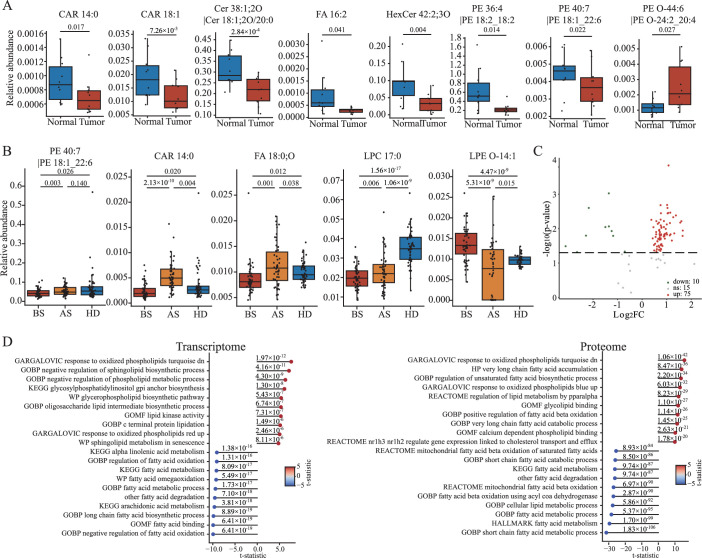
Figure EV4. Analysis of the metabolites in SLMS.
(A) The significantly changed metabolites between gastric cancer (n = 10) and normal tissues (n = 10). (B) Metabolites that partially or completely return to normal levels after surgery (n = 50 per group). (C) Volcano plot showing the lipids that were differentially expressed between GC and normal regions. (D) Top 10 lipid-related metabolic pathways highly expressed in cancer tissues and normal tissues according to the transcriptome and proteome analysis. P values were determined by T test (A–D) and adjusted via the Benjamini-Hochberg procedure (D). The definitions of box plots in (A) and (B) were consistent with those in Fig. 3A,B. AS after surgery, BS before surgery, HD healthy donor, SLMS serum lipid metabolic signature.

