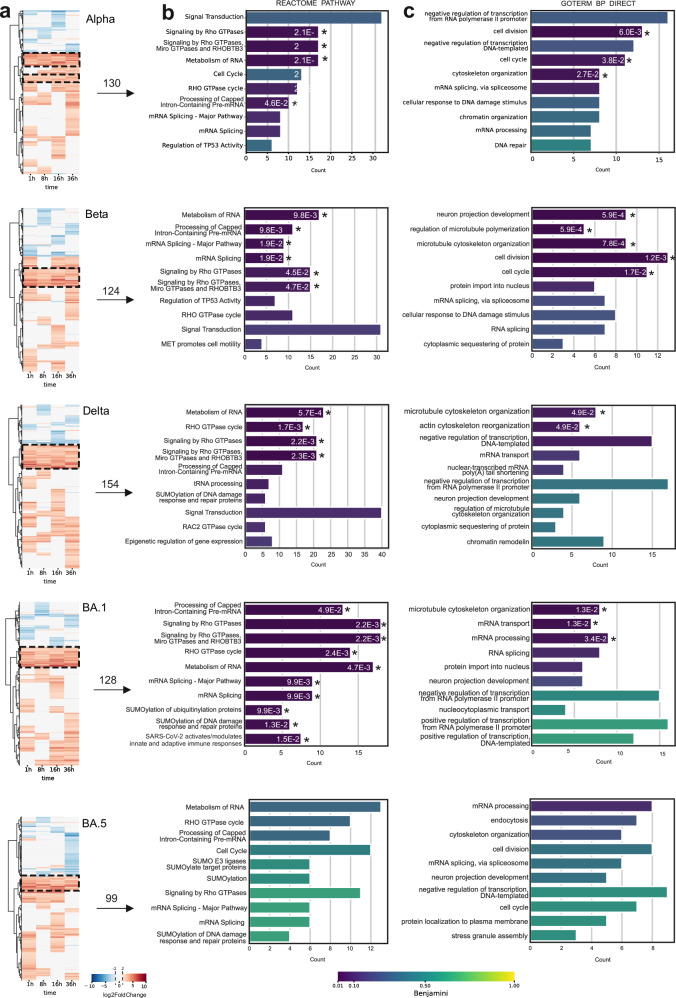
Fig. 3. Time-course phosphoproteome analysis of SARS-CoV-2 variant infection.
a Cluster plot illustrating the temporal dynamics of protein phosphorylation across different time points during SARS-CoV-2 variant infections. A comprehensive comparison was conducted between variants and mock cells to identify the variant-specific upregulation (red) or downregulation (blue). The numbers above the arrows represent the unique proteins detected in each boxed upregulated cluster. b, c Selected clusters of consistently upregulated phosphorylation events were analyzed for Reactome pathway enrichment (b) and GO Biological Process enrichment (c) using the DAVID functional annotation tool. The top 10 enriched pathways and processes, ranked by count, are shown with their respective adjusted P-values (Benjamini). An asterisk adjacent to each bar indicates a statistically significant enrichment threshold (P < 0.05), with the corresponding adjusted P-value.

