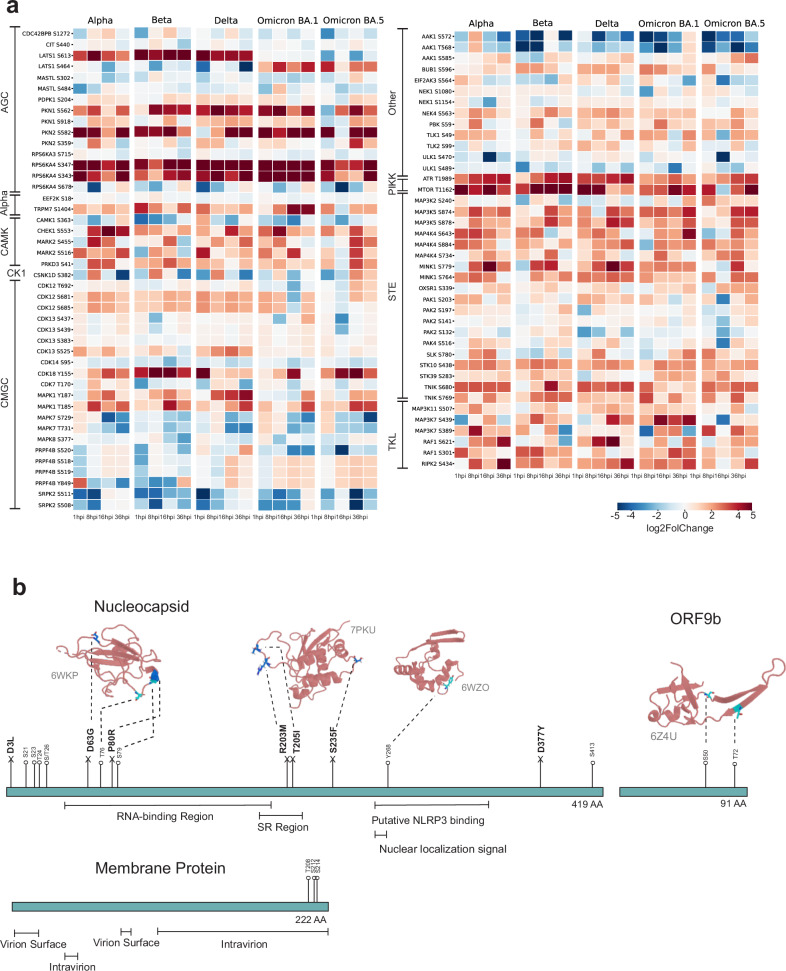
Fig. 4. Protein kinase phosphorylation during SARS-CoV-2 infection.
a Identified protein kinase phosphorylation events (phosphosites) detected and compared to mock. Red represents upregulation and blue indicates downregulation. b Protein phosphorylation events detected in the SARS-CoV-2 N, ORF9b, and M proteins, with their position shown in the corresponding protein sequence in cyan, and the ORF-specific mutations highlighted in marine.

