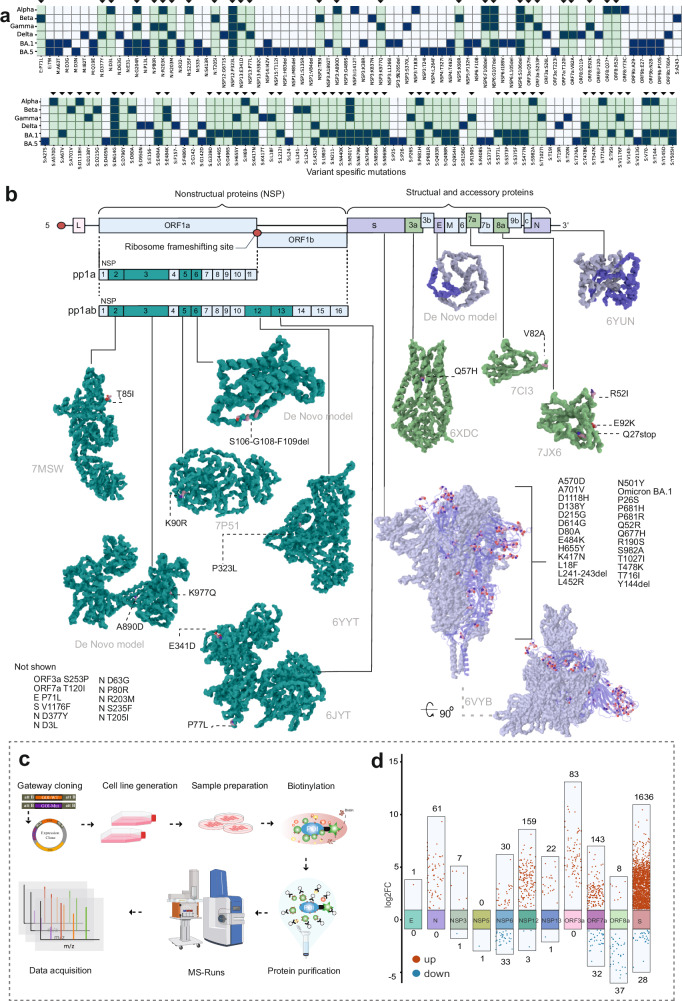
Fig. 5. Protein–protein interaction changes detected for the 50 mutations in the SARS-CoV-2 variants.
a An overview of all mutations detected in SARS-CoV-2 variant proteins (dark blue). Mutations selected for this study are highlighted in green and small arrow at the top of the columns. b Genomic architecture of SARS-CoV-2, which includes 14 ORFs encoding structural proteins (S, E, M, and N), non-structural proteins (pp1a and pp1ab), and nine accessory proteins. Structures of 12 selected viral proteins with their corresponding PDB IDs (RCSB PDB database) are shown, with variant-specific mutations highlighted in light pink. Structural proteins are shown in slate blue, and other ORFs in limon. NSPs cleaved from pp1a and pp1ab are depicted in teal. c Schematic illustration of the BioID pipeline. The MAC-tagged viral ORF generates an inducible ORF-expressing cell line, and interacting proteins are purified using single-step affinity purification, followed by MS analysis. d Multi-group difference scatter plot derived from PPI data, comparing mutations in each viral ORF to the WT viral ORF at the MS1 level. Significant changes in protein levels were identified, and these proteins were cross-referenced with a high-confidence list of interacting proteins from spectral count (MS2) data. The scatter plot displays log2FC values on the y-axis against comparison groups on the x-axis with the number above (upregulated) or below (downregulated) each bar indicating the number of significant interactions with the viral protein.

