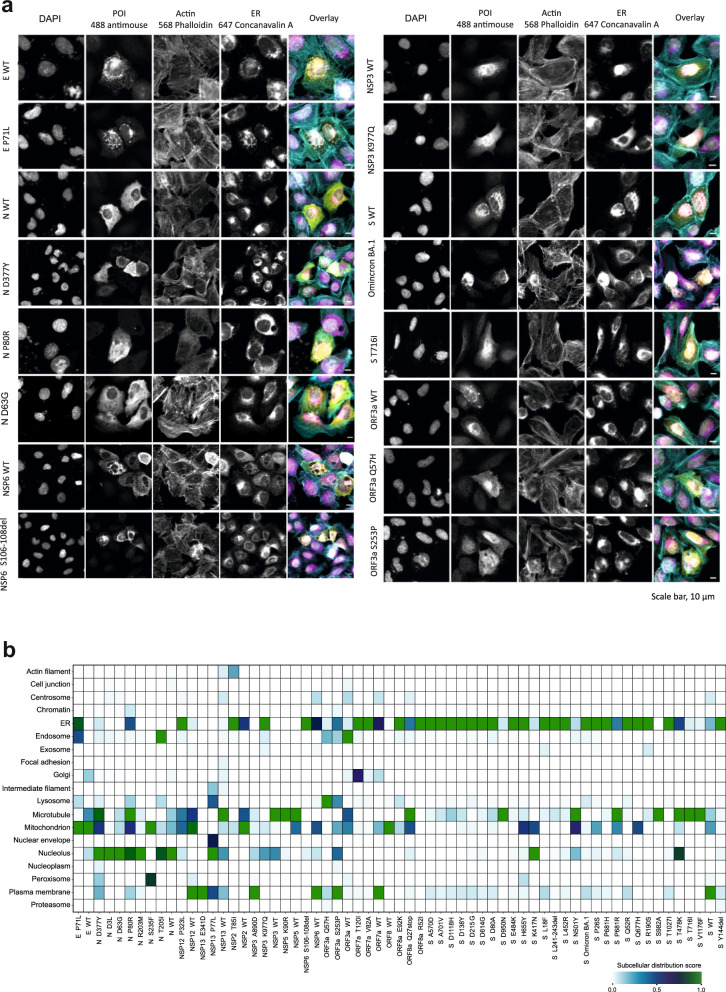
Fig. 6. Molecular microscopy and immunofluorescence analysis of the SARS-CoV-2 mutation localization and induced cellular phenotypes.
a Immunofluorescence microscopy images of the SARS-CoV-2 proteins expressed from the MAC-tagged viral ORFs, transfected into U2-OS cells, and detected by immunofluorescence. Scale bars, 10 µm. b MS-microscopy analysis heatmap of the mutations from VOCs, illustrating the estimated localization of the bait protein based on proximity-dependent biotin identification coupled with MS interaction results.

