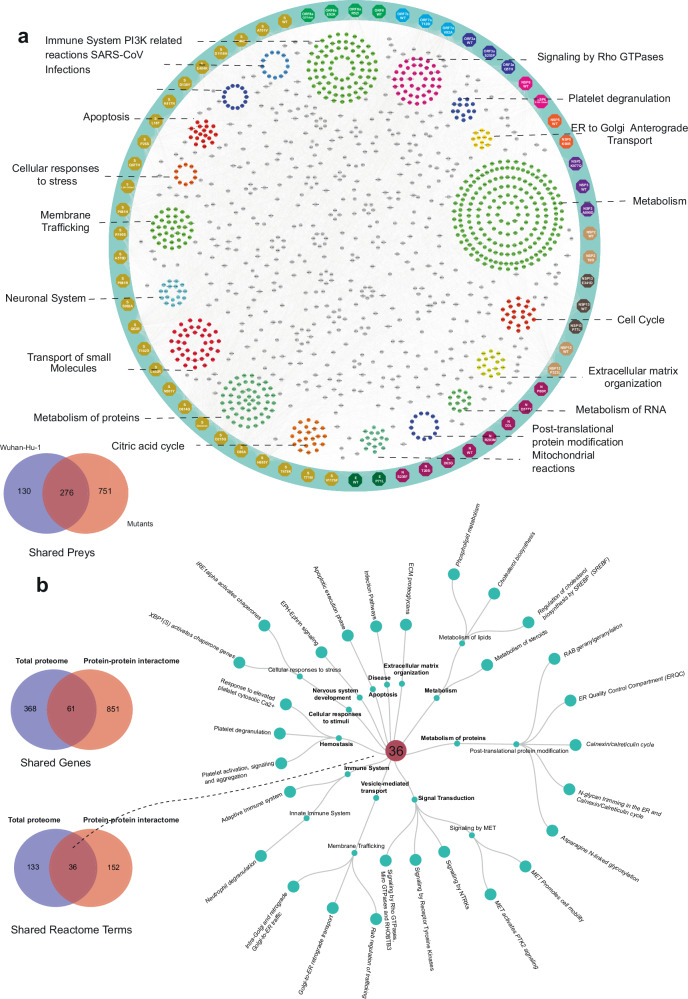
Fig. 7. SARS-CoV-2–host physical and functional interaction knowledge graph.
a SARS-CoV-2 high-confidence interactome map with the 12 WT and 50 mutated SARS-CoV-2 proteins. The enriched Reactome term clusters display interactions with preys with the corresponding terms. The Venn diagram showing the prey overlap detected by WT and mutated ORFs. b The circular dendrogram of 36 Reactome pathways depicts the overlap of Reactome terms between the two datasets. The Venn diagrams illustrate shared proteins and Reactome terms between the global proteome dataset and the BioID dataset.

