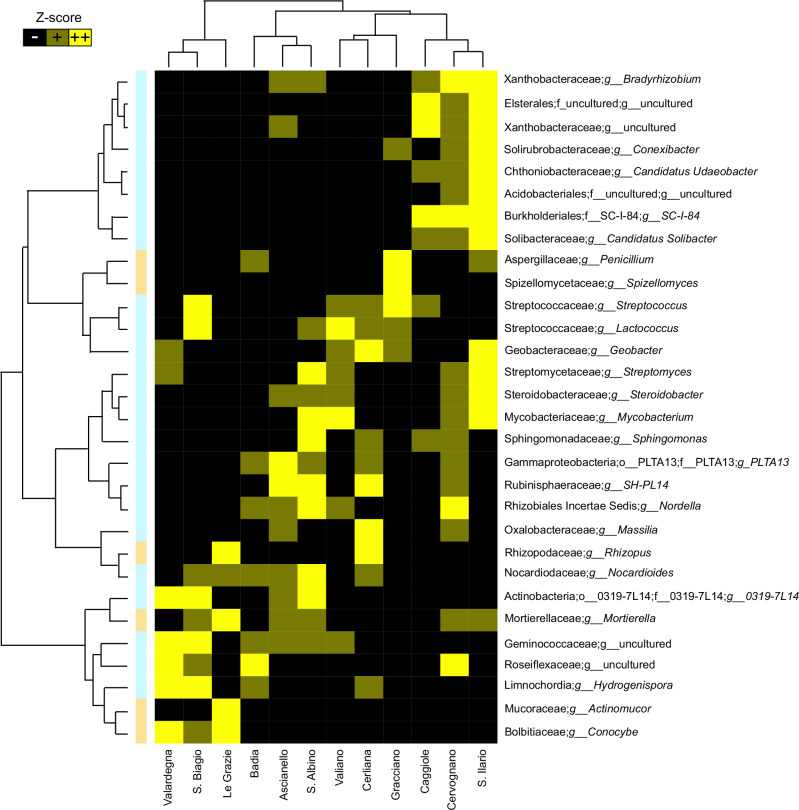
Fig. 5. The AGU-related taxa show a relative abundance gradient in the Montepulciano area, describing the rhizospheric microbial variation across the 12 additional geographical units (AGUs).
Heatmap showing all significantly discriminating genera among the rhizosphere microbiomes of the 12 AGUs (random forest combined with the Kruskal–Wallis test among relative taxon abundances in each AGU, p-value ≤ 0.05). Relative taxon abundance is represented in the heatmap through z-score. The vertical bar is colored blue for bacteria and orange for fungi.

