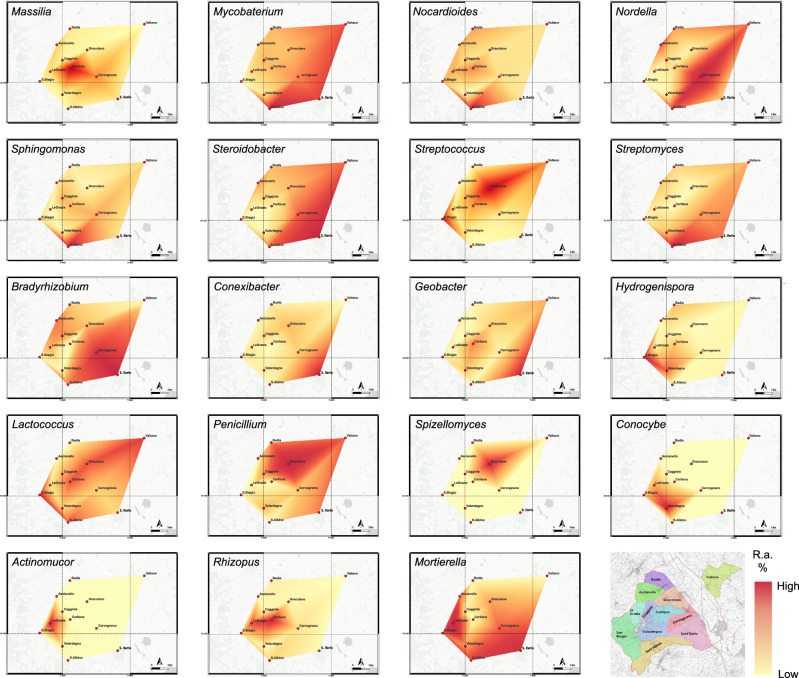
Fig. 6. The AGU-related taxa show a pattern of relative abundance variation across the 12 additional geographical units (AGUs).
Maps of the relative abundance of discriminating microbial components of the rhizosphere, both bacterial and fungal. The AGU map is shown at the bottom right for reference to the AGU location, together with a color code for the relative abundance percentage (r.a. %). All maps were created using the QGIS open-source tool (https://www.qgis.org/it/site/).

