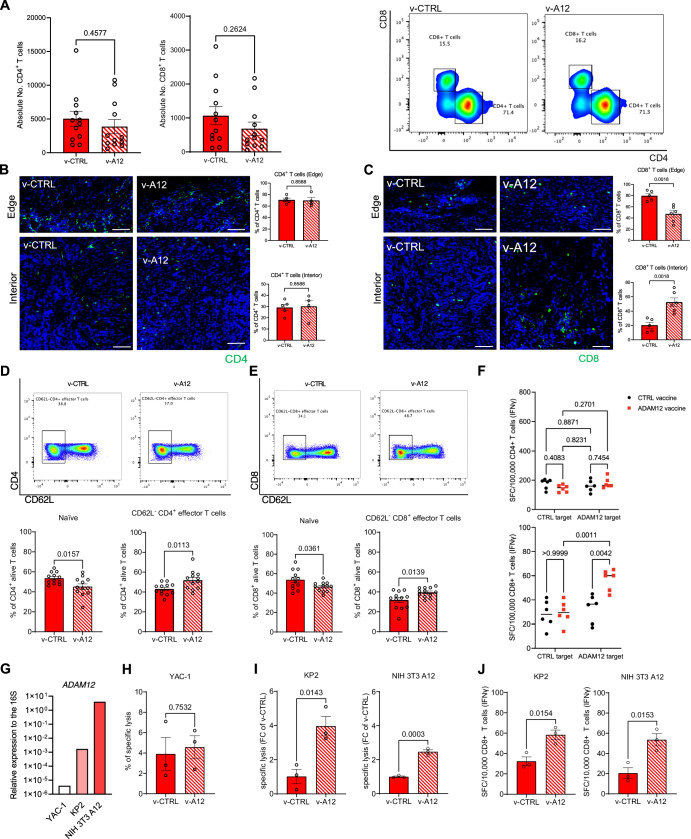
Figure 2. Prophylactic ADAM12 vaccination stimulates specific T cell response in PDAC tumor-bearing mice.
(A) Quantitative analysis by flow cytometry of absolute count of CD4+ T cells (left) and CD8+ T cells (middle) in tumor samples from subcutaneous PDAC model treated with control vaccine (v-CTRL) and ADAM12 vaccine (v-A12), along with corresponding gating strategy (right). (n = 12 mice in v-CTRL and v-A12 respectively. Data were presented as mean ± SEM. Statistical test: unpaired two-tailed Student’s t-test.). (B) Quantitative analysis of CD4+ T cell population at the edge of PDAC tumor tissue (left, upper) and interior of PDAC tissue (left, bottom), along with corresponding representative images. (n = 5 mice in v-CTRL and n = 4 mice in v-A12. Data were presented as mean ± SEM. Statistical test: unpaired two-tailed Student’s t-test. Scale bar 50 μm). (C) Quantitative analysis of CD8+ T cell population at the edge of PDAC tumor tissue (left, upper) and interior of PDAC tissue (left, bottom), along with corresponding representative images. (n = 5 mice in v-CTRL and n = 6 mice in v-A12. Data were presented as mean ± SEM. Statistical test: unpaired two-tailed Student’s t-test. Scale bar 50 μm). (D) Representative flow cytometry gating (upper) of CD62L- CD4+ effector T cells between control-vaccinated (v-CTRL) mice and ADAM12-vaccinated (v-A12) mice; corresponding quantitative analysis of naïve CD4+ T cells (bottom, left) and CD62L- CD4+ effector T cells (bottom, right) within splenic CD4+ T cells from PDAC tumor-bearing mice treated with control vaccine (v-CTRL) and ADAM12 vaccine (v-A12). (n = 12 mice in v-CTRL and v-A12 respectively. Data were presented as mean ± SEM. Statistical test: unpaired two-tailed Student’s t-test.). (E) Representative flow cytometry gating of CD62L- CD8+ effector T cells (upper) between control-vaccinated mice and ADAM12-vaccinated mice; corresponding quantitative result of naïve CD8+ T cells (bottom, left) and CD62L- CD8+ effector T cells (bottom, right) within splenic CD8+ T cells from PDAC tumor-bearing mice treated with control vaccine (v-CTRL) and ADAM12 vaccine (v-A12). (n = 12 mice in v-CTRL and v-A12 respectively. Data were presented as mean ± SEM. Statistical test: unpaired two-tailed Student’s t-test.). (F) Spot-forming cells (SFC) in IFN-γ ELISpot of splenic CD4+ T cell and CD8+ T cell populations purified from tumor-bearing animals vaccinated with v-CTRL or v-A12 and restimulated with MutuDC1940 cells expressing ADAM12-derived epitopes (ADAM12 target) or with corresponding CTRL target (TurboGFP alone). (n = 6 independent samples in v-CTRL and v-A12 respectively. Data were presented as mean ± SEM. Statistical test: two-way ANOVA.). (G) Gene expression analysis of Adam12 in YAC-1, “KPPC”-derived KP2 PDAC cells (KP2) and ADAM12-expressing NIH 3T3 cells (NIH 3T3 A12). (H) Spontaneous baseline killing of YAC-1 cells by purified splenic CD8+ T cells from PDAC tumor-bearing mice vaccinated with v-CTRL or v-A12. (n = 3 independent samples in v-CTRL and v-A12, respectively. Data were presented as mean ± SEM. Statistical test: unpaired two-tailed Student’s t-test.). (I) Cytotoxic assay of purified splenic CD8+ T cells from PDAC tumor-bearing mice vaccinated with v-CTRL or v-A12 with target cells (KP2, NIH 3T3 A12). Data represented as fold change to v-CTRL. (n = 3 samples in v-CTRL and v-A12, respectively. Data were presented as mean ± SEM. Statistical test: unpaired two-tailed Student’s t-test.). (J) Spot-forming cells (SFC) in IFN-γ ELISpot of purified splenic CD8+ T cells from PDAC tumor-bearing mice vaccinated with control vaccine (v-CTRL) or ADAM12 vaccine (v-A12) co-cultured with target cells (KP2, NIH 3T3 A12). (n = 3 samples in v-CTRL and v-A12, respectively. Data were presented as mean ± SEM. Statistical test: unpaired two-tailed Student’s t-test). Source data are available online for this figure.

