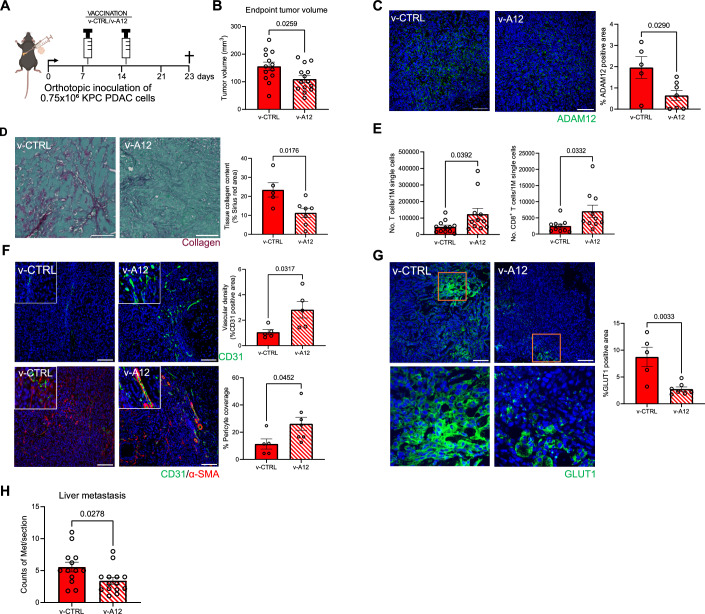
Figure 4. Therapeutic vaccination against ADAM12 limits the growth of orthotopic pancreatic carcinomas.
(A) Experimental scheme of therapeutic ADAM12 vaccination (v-A12) on orthotopic KPC PDAC tumor-bearing mice. (B) Tumor volume at the endpoint, day 23. (n = 13 mice in v-CTRL, n = 14 mice in v-A12. Data were presented as mean ± SEM. Statistical test: unpaired two-tailed Student’s t-test.). (C) Representative images of ADAM12 immunostaining (left) (ADAM12 antibody, Invitrogen, PA5-50594) and quantitative analysis of ADAM12-positive area (right) on tumor sections of orthotopic PDAC allografts treated with v-CTRL and v-A12. (n = 5 mice in v-CTRL, n = 7 mice in v-A12. Data were presented as mean ± SEM. Statistical test: unpaired two-tailed Student’s t-test. Scale bar 100 μm). (D) Representative images of collagen tissue collagen deposition by Sirius Red/Fast Green staining (left) and quantitative analysis of collagen deposition (right) on tumor sections of orthotopic PDAC allografts treated with v-CTRL and v-A12. (n = 5 mice in v-CTRL and n = 7 mice in v-A12. Data were presented as mean ± SEM. Statistical test: unpaired two-tailed Student’s t-test. Scale bar 50 μm). (E) FACS analysis of the total number of T cells (left) and CD8+ T cells (right) per 1 M single cells analyzed in orthotopic PDAC tumors. (n = 10–12 mice in v-CTRL, n = 10–11 mice in v-A12. Data were presented as mean ± SEM. Statistical test: unpaired two-tailed Student’s t-test.). (F) Representative immunofluorescence staining images (left) and quantitative analysis of vascular density as indicated by CD31 (upper, right) and pericyte coverage assessed by α-SMA/CD31 co-localization (bottom, right) on PDAC tumors with either control vaccine (v-CTRL) or ADAM12 vaccine (v-A12). (n = 5 mice in v-CTRL and n = 7 mice in v-A12. Data were presented as mean ± SEM. Statistical test: unpaired two-tailed Student’s t-test. Scale bar 100 μm). (G) Representative immunofluorescence staining images (left) and quantitative analysis of tumor hypoxia via the coverage of GLUT1-positive cells (fight) on orthotopic PDAC from v-CTRL mice v-A12 mice. (n = 5 mice in v-CTRL and n = 7 mice in v-A12. Data were presented as mean ± SEM. Statistical test: unpaired two-tailed Student’s t-test. Scale bar 100 μm). (H) Liver metastasis quantification. (n = 13 mice in v-CTRL, n = 14 mice in v-A12. Data were presented as mean ± SEM. Statistical test: unpaired two-tailed Student’s t-test.). Source data are available online for this figure.

