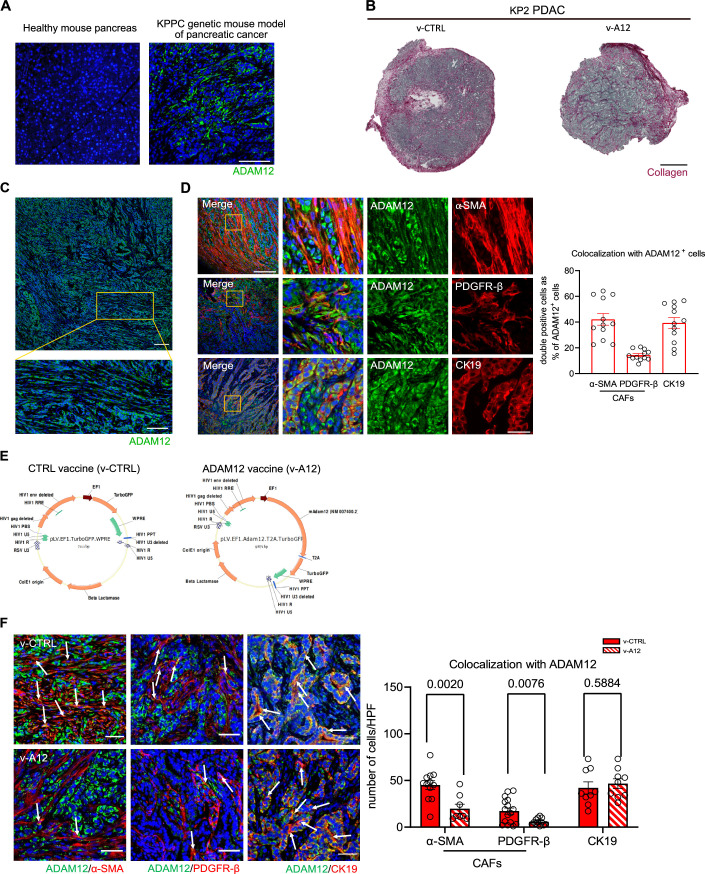
Figure EV1. ADAM12 expression and characterization on KP2 PDAC tumor tissue.
(A) Representative image of ADAM12 immunofluorescence staining (ADAM12 antibody, Invitrogen, PA5-50594) on the healthy pancreas and PDAC tumor tissue from KPPC transgenic mice. (Scale bar 100 μm). (B) Representative images of Sirius Red/Fast Green staining on subcutaneous KP2 PDAC sections from v-CTRL mice and v-A12 mice. (Scale bare 100 μm). (C) Representative image of ADAM12 immunostaining (ADAM12 antibody, Invitrogen, PA5-50594) on PDAC tumor sections from subcutaneous KP2 PDAC grafts. (Scale bar 100 μm; for the zoom-in picture, the scale bar is 50 μm). (D) Representative images (left) and quantitative analysis (right) of ADAM12+ cell characterization, ADAM12+ CAFs were indicated as ADAM12+/α-SMA+ (upper, left) and ADAM12+/PDGFR-β+ (middle, left), and ADAM12+ tumor cells were indicated as ADAM12+/CK19+ (bottom, left) co-expression on subcutaneous KP2 PDAC tumors. (n = 12 fields of view from four mice. Data were presented as mean ± SEM. Scale bar is 200 μm, and the scale bar of the zoomed-in picture is 50 μm). (E) Vector maps of CTRL vaccine (v-CTRL) and ADAM12 vaccine (v-A12). (F) Quantitative analysis of ADAM12+/α-SMA+ (left, left), ADAM12+/PDGFR-β+ (left, middle), and ADAM12+/CK19+ (left, right) co-expression on PDAC tumors from control-vaccinated mice (v-CTRL) and ADAM12-vaccinated mice (v-A12). Data were represented as the number of cells per high power field (HPF). Representative double positive cells were indicated by white arrows respectively. (n = 12–16 in v-CTRL, n = 8–9 in v-A12. Data were presented as mean ± SEM. Statistical test: multiple t-test. Scale bar 50 μm).

