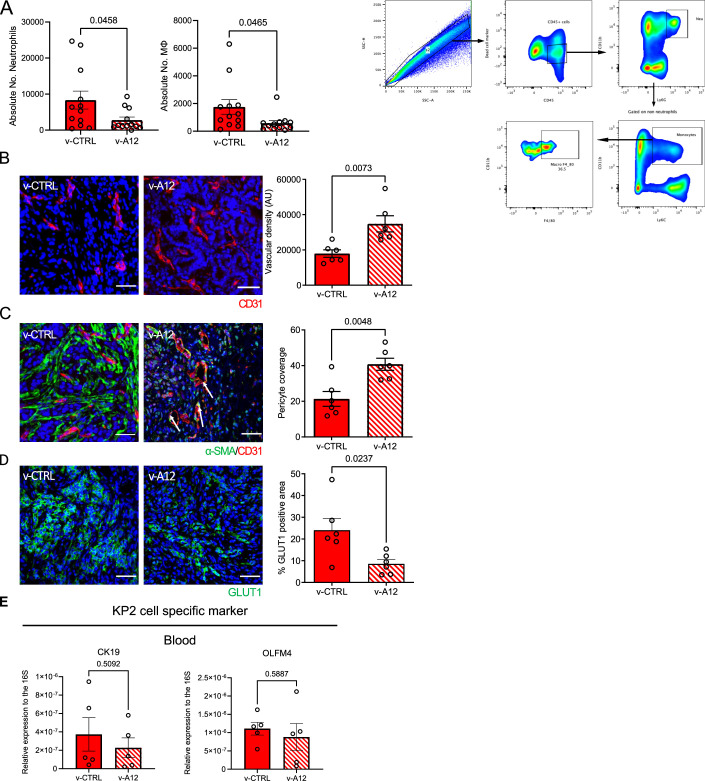
Figure EV2. Prophylactic ADAM12 vaccination increased tumor vascular density and pericyte coverage.
(A) Quantitative analysis of the absolute number of neutrophils (left) and macrophages (middle) within PDAC tumor tissues from control-vaccinated mice (v-CTRL) and ADAM12-vaccinated mice (v-A12); corresponding flow cytometry gating strategy of myeloid cells (right): neutrophils were identified as CD45+CD11b+Ly6G+ cells; monocytes were gated based on non-neutrophils (negative gating), and then identified as CD11b+Ly6C+ population. Then, monocyte macrophages were further defined with an F4/80+ signal. (n = 12 mice in v-CTRL, n = 12 mice in v-A12. Data were presented as mean ± SEM. Statistical test: unpaired two-tailed Student’s t-test). (B) Representative immunofluorescence staining images (left) and quantitative analysis of CD31-positive endothelial cells (right) on PDAC tumors from mice treated with either control vaccine (v-CTRL) or ADAM12 vaccine (v-A12). (n = 6 mice in v-CTRL, n = 6 mice in v-A12. Data were presented as mean ± SEM. Statistical test: unpaired two-tailed Student’s t-test. Scale bar 50 μm). (C) Representative immunofluorescence staining images (left) and quantitative analysis of pericyte coverage assessed by α-SMA/CD31 co-localization on PDAC tumors with either control vaccine (v-CTRL) or ADAM12 vaccine (v-A12) and representative images of α-SMA/CD31 immunostaining. (n = 6 mice in v-CTRL, n = 6 mice in v-A12. Data were presented as mean ± SEM. Statistical test: unpaired two-tailed Student’s t-test. Scale bar 50 μm). (D) Representative immunofluorescence staining images (left) and quantitative analysis of tumor hypoxia via GLUT1-positive cells on subcutaneous PDAC from v-CTRL mice and v-A12 mice together with representative images of GLUT1 immunostaining. (n = 6 mice in v-CTRL, n = 6 mice in v-A12. Data were presented as mean ± SEM. Statistical test: unpaired two-tailed Student’s t-test. Scale bar 50 μm). (E) Gene expression analysis of the KP2-specific gene CK19 in peripheral blood at endpoint (day 28 post tumor inoculation) from subcutaneous PDAC mouse model with control vaccine (v-CTRL) or ADAM12 vaccine (v-A12). (n = 5 mice in v-CTRL, n = 5 mice in v-A12. Data were presented as mean ± SEM. Statistical test: unpaired two-tailed Student’s t-test).

