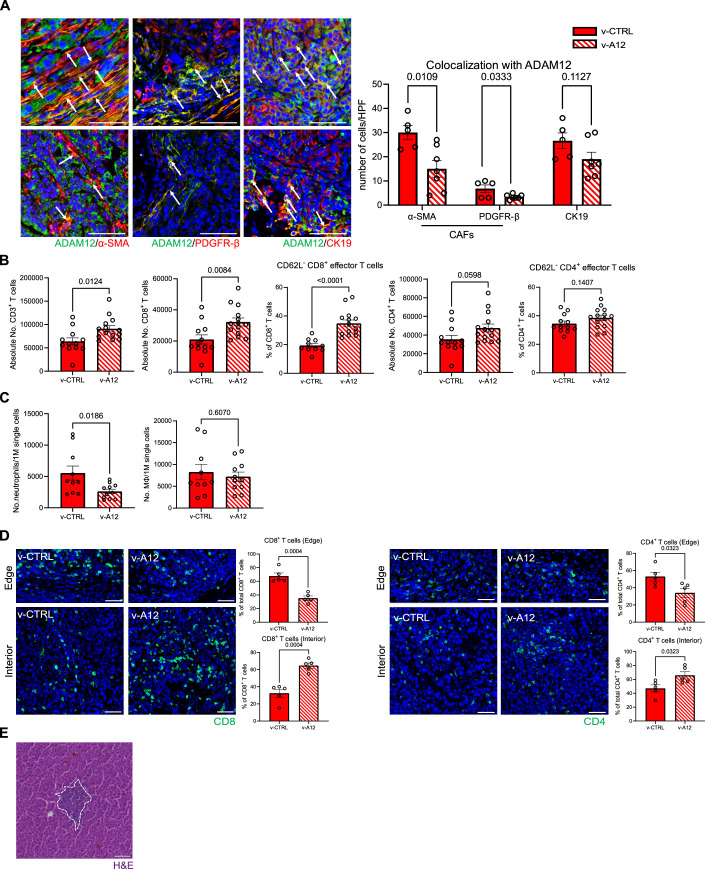
Figure EV5. Therapeutic ADAM12 vaccination in mice bearing orthotopic PDAC tumors decreased ADAM12+CAFs, stimulated splenic CD8 T cell response, and promoted T cell relocalization within the PDAC tumor tissue.
(A) Representative immunofluorescence staining images (left) and quantitative analysis (right) of ADAM12+/α-SMA+ (left, left), ADAM12+/PDGFR-β+ (left, middle) and ADAM12+/CK19+ (left, right) co-expression on PDAC tumors from control-vaccinated mice (v-CTRL, n = 5 mice) and ADAM12-vaccinated mice (v-A12, n = 7 mice). Data were represented as the number of cells per high power field (HPF). Representative double positive cells were indicated by white arrows respectively. (n = 5 in v-CTRL, n = 7 in v-A12. Data were presented as mean ± SEM. Statistical test: unpaired two-tailed Student’s t-test. Scale bar 50 μm). (B) Quantitative FACS analysis of the absolute number of T cells, CD8+ T cells, CD62L-CD8+ effector T cells, CD4+ T cells, and CD62L-CD4+ effector T cells in spleens from control-vaccinated mice (v-CTRL) and ADAM12-vaccinated mice (v-A12). (n = 12 mice in v-CTRL, n = 14 mice in v-A12. *n = 10 mice in v-CTRL in the CD62L-CD8+ effector T cell population because of two outliers. Data were presented as mean ± SEM. Statistical test: unpaired two-tailed Student’s t-test.). (C) Quantitative analysis of the number of neutrophils (left) and macrophages (right) per 1 M single cells in PDAC tumors from control-vaccinated mice (v-CTRL) and ADAM12-vaccinated mice (v-A12). (n = 10 mice in v-CTRL, n = 11 mice in v-A12. Data were presented as mean ± SEM. Statistical test: unpaired two-tailed Student’s t-test.). (D) Representative images of CD8+ T cell (left) and CD4+ T cell (right) localization, and quantitative analysis of CD8+ T cell and CD4+ T cell population at the edge of PADC tumor tissue (right, upper) and the interior of PDAC tumor tissue (right, bottom). (n = 5 mice in v-CTRL, n = 5 mice in v-A12. Data were presented as mean ± SEM. Statistical test: unpaired two-tailed Student’s t-test. Scale bar 50 μm). (E) Representative hepatic micrometastasis (area indicated within the white dotted outline) image with H&E staining, scale bar 50 µm.

