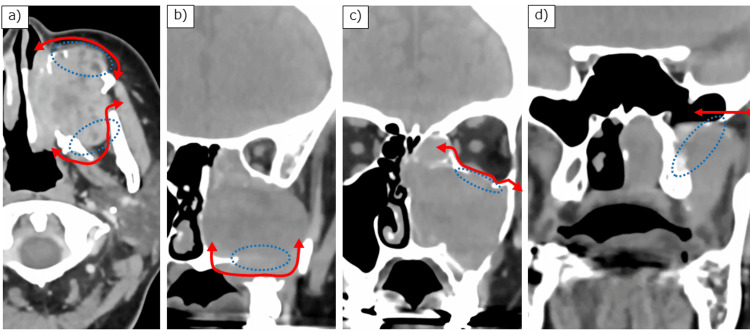
Figure 1. Preoperative computed tomography images.
(a) Axial image showing bone infiltration in the anterior and posterior maxillary walls; (b, c) Coronal images showing infiltration in the inferior and superior maxillary walls, respectively; and (d) The base of the sphenoid pterygoid process. Blue dotted line: bone infiltration site; red arrow: resection line.

