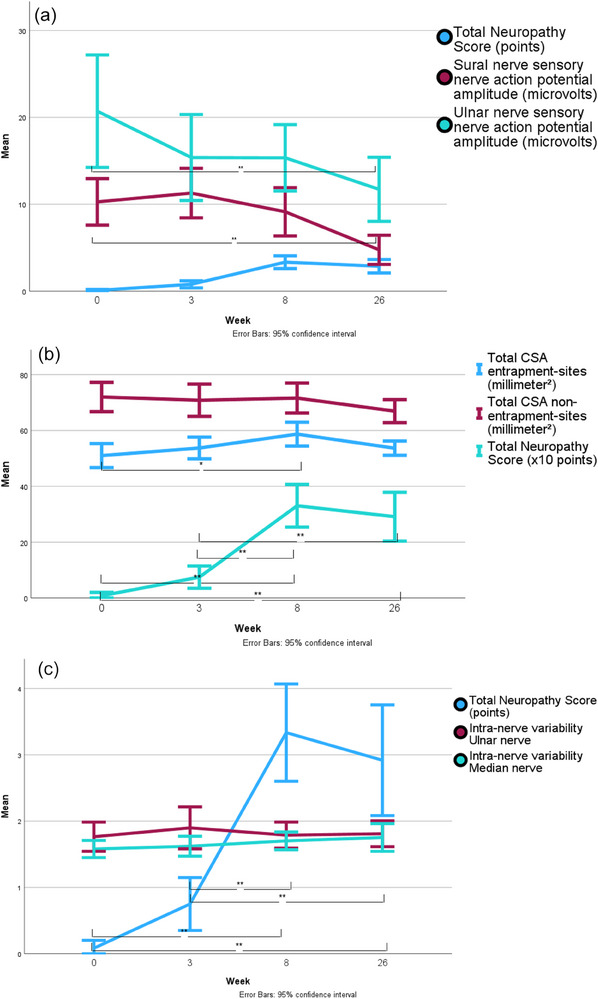
FIGURE 3.

Evolution of the sural and ulnar nerve sensory action potential and the total neuropathy score (TNS) at different visits (A). Evolution of the total cross‐sectional area (CSA) calculated for entrapment sites and nonentrapment sites and the TNS at different visits (B). Evolution of the intranerve variability of the ulnar and median nerve and the TNS at different visits (C). Significant differences for the TNS at different visits are indicated only in panels (B) and (C). *p < .01; **p < .001. N = 12.
