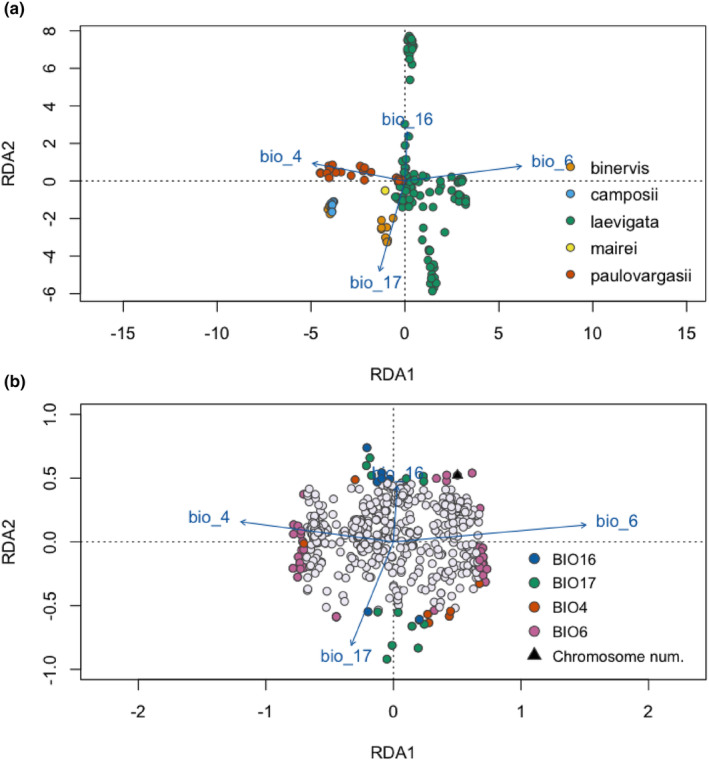
FIGURE 4.

The RDA analysis. (a) Dots represent the coordinates of populations in the biplot of the first two RDA axes with colours indicating Carex species. (b) Dots represent the coordinates of SNPs in the biplot of the first two RDA axes and coloured dots represent outlier SNPs showing the highest correlation values with colour‐coded environmental predictors. The projection of environmental predictors used in the RDA analysis is also displayed.
