FIGURE 2.

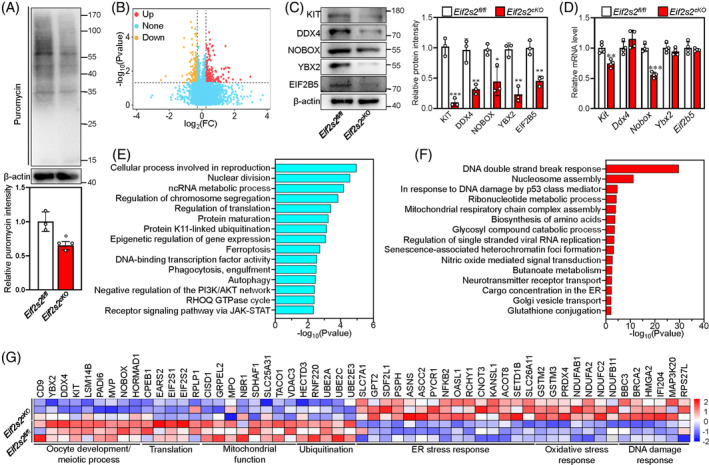
Deletion of Eif2s2 results in the downregulation of proteins related to oocyte development and meiosis and the upregulation of stress response proteins. (A) The nascent protein synthesis level was detected in Eif2s2 fl/fl and Eif2s2 cKO ovaries at 1 dpp treated with 1 ng/mL puromycin for 1 h using an anti‐puromycin antibody. The intensity of nascent synthesized protein was quantified using β‐actin as an internal control. n = 3. (B) Volcano plot comparing the proteins of Eif2s2 fl/fl and Eif2s2 cKO ovaries at 1 dpp. Proteins that increased or decreased by >1.2‐fold in Eif2s2 cKO ovaries are highlighted in red or orange, respectively. (C) Western blotting (WB) analysis of KIT, NOBOX, DDX4, YBX2, EIF2S1 and EIF2B5 expression within Eif2s2 fl/fl and Eif2s2 cKO mouse ovaries. β‐actin was utilized as an internal control. n = 3. (D) The mRNA levels of Ddx4, Kit, Nobox, Ybx2, Eif2s1 and Eif2b5 in ovaries from Eif2s2 fl/fl and Eif2s2 cKO mice at 1dpp. n = 4. (E and F) Bar graphs illustrating the enriched GO/KEGG terms or canonical pathways associated with the proteins that have decreased (E) or increased (F) levels in Eif2s2 cKO ovaries. (G) Heatmaps depict differences between Eif2s2 fl/fl and Eif2s2 cKO ovaries in the expression of proteins involved in various processes. Bars represent the mean ± SD. A two‐sided Student's t‐test was performed to determine p values (*p < 0.05, **p < 0.01 and ***p < 0.001).
