
FIGURE 8.
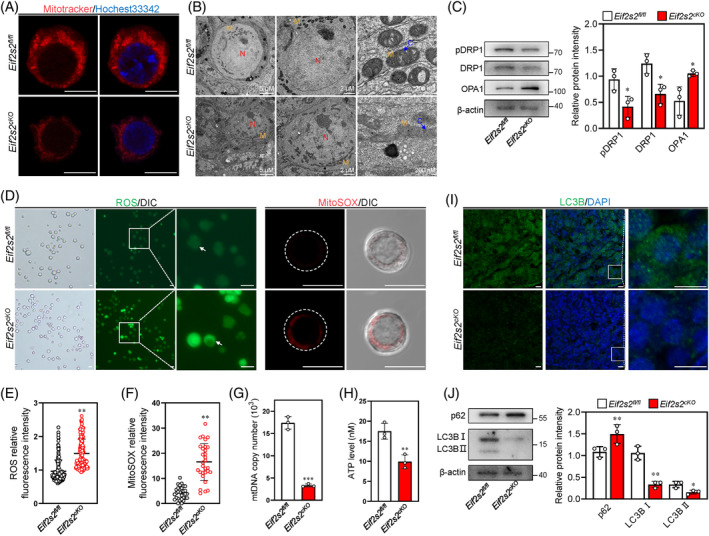
Eif2s2 deletion in oocytes causes mitochondrial dysfunction. (A) The representative images for the Mitotracker intensity in oocytes from Eif2s2 fl/fl and Eif2s2 cKO mice. (B) Transmission electron microscopy (TEM) images of primordial follicles, nucleus and mitochondria from Eif2s2 fl/fl and Eif2s2 cKO mouse at 3 dpp. C, cristae of mitochondria; M, mitochondria; N, nucleus. Scale bars were indicated in the graphs. (C) Western blotting (WB) analysis of DRP1, pDRP1 and OPA1 expression within Eif2s2 fl/fl and Eif2s2 cKO mouse ovaries. β‐actin was utilized as an internal control. (D–F) The fluorescence staining of ROS using DCFH‐DA (green, D) and mitochondrial superoxide using MitoSOX (red, D), and relative fluorescence intensity of ROS (E) and MitoSOX (F) in oocytes of Eif2s2 fl/fl and Eif2s2 cKO mice. ROS: Eif2s2 fl/fl n = 151, Eif2s2 cKO n = 174. MitoSOX: Eif2s2 fl/fl n = 31, Eif2s2 cKO n = 30. (G and H) The mtDNA copy numbers (G) and the ATP levels (H) in oocytes of Eif2s2 fl/fl and Eif2s2 cKO mice. n = 3. (I) Immunostaining of LC3B (green) in Eif2s2 fl/fl and Eif2s2 cKO mouse ovaries. DAPI, blue. (J) WB analysis of p62 and LC3B expression within Eif2s2 fl/fl and Eif2s2 cKO mouse ovaries. β‐actin was utilized as an internal control. n = 3. Scale bar: 10 μm (A, D, I). Bars represent the mean ± SD. A two‐sided Student's t‐test was performed to determine p values (*p < 0.05, **p < 0.01 and ***p < 0.001).