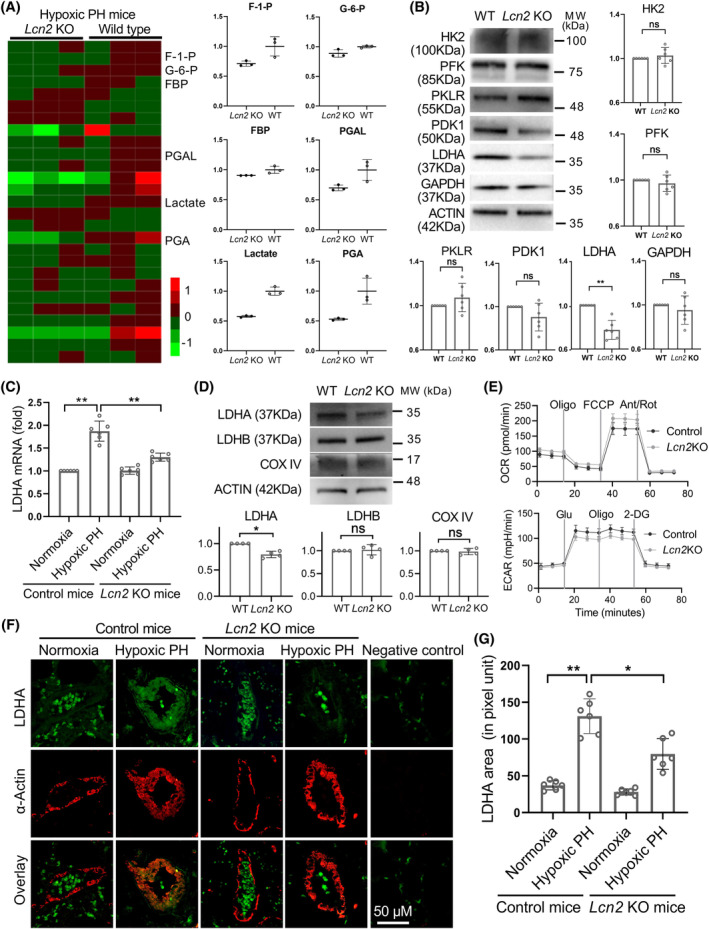
FIGURE 2.

LCN2 deficiency in mice inhibits the glycolysis of hypoxia‐induced PH. A, WT and Lcn2 KO mice were exposed to hypoxia or normoxia for 4 weeks. Heatmap of metabolome profiles from mouse lung tissue samples. Heatmap colours represent relative metabolite levels as indicated in the colour key. The significantly changed metabolites were shown as histograms. F‐1‐P, fructose‐1‐phosphate; G‐6‐P, glucose‐6‐phosphate; FBP, fructose‐1,6‐phosphate; PGAL, glyceraldehydes‐3‐phosphate; PGA, 3‐phosphoglyceric acid. (B), Western blot and quantification analysis of the levels of glycolytic enzymes in lung homogenates of WT and Lcn2 KO mice. (C), Real‐time PCR analysis of LDHA mRNA levels in lung homogenates of WT and Lcn2 KO mice exposed to hypoxia or normoxia. (D), The PASMCs were isolated from Lcn2 KO and control mice with hypoxic PH. Western blot and quantification analysis of the levels of glycolytic enzymes in isolated PASMCs. (E), Extracellular acidification rate (ECAR) and oxygen consumption rate (OCR) were measured to evaluate the glycolysis and mitochondrial respiration of isolated PASMCs. (F and G), Lung slides were double stained for LDHA (green) and α‐Actin (red). Representative images and quantification of LDHA staining in distal pulmonary artery of WT and Lcn2 KO mice exposed to hypoxia or normoxia. Results are expressed as mean ± SE. n = 6 mice per group (B, C and G), n = 3 data point (each data point represents the result of a mixed blood sample from two mice in the same group) (A and E), or n = 4, independent experiments (D). Statistical significance was determined by Mann–Whitney U test (A, B, D and E) or Kruskal–Wallis test (C and G). * p < 0.05 and ** p < 0.01, ns p > 0.05.
