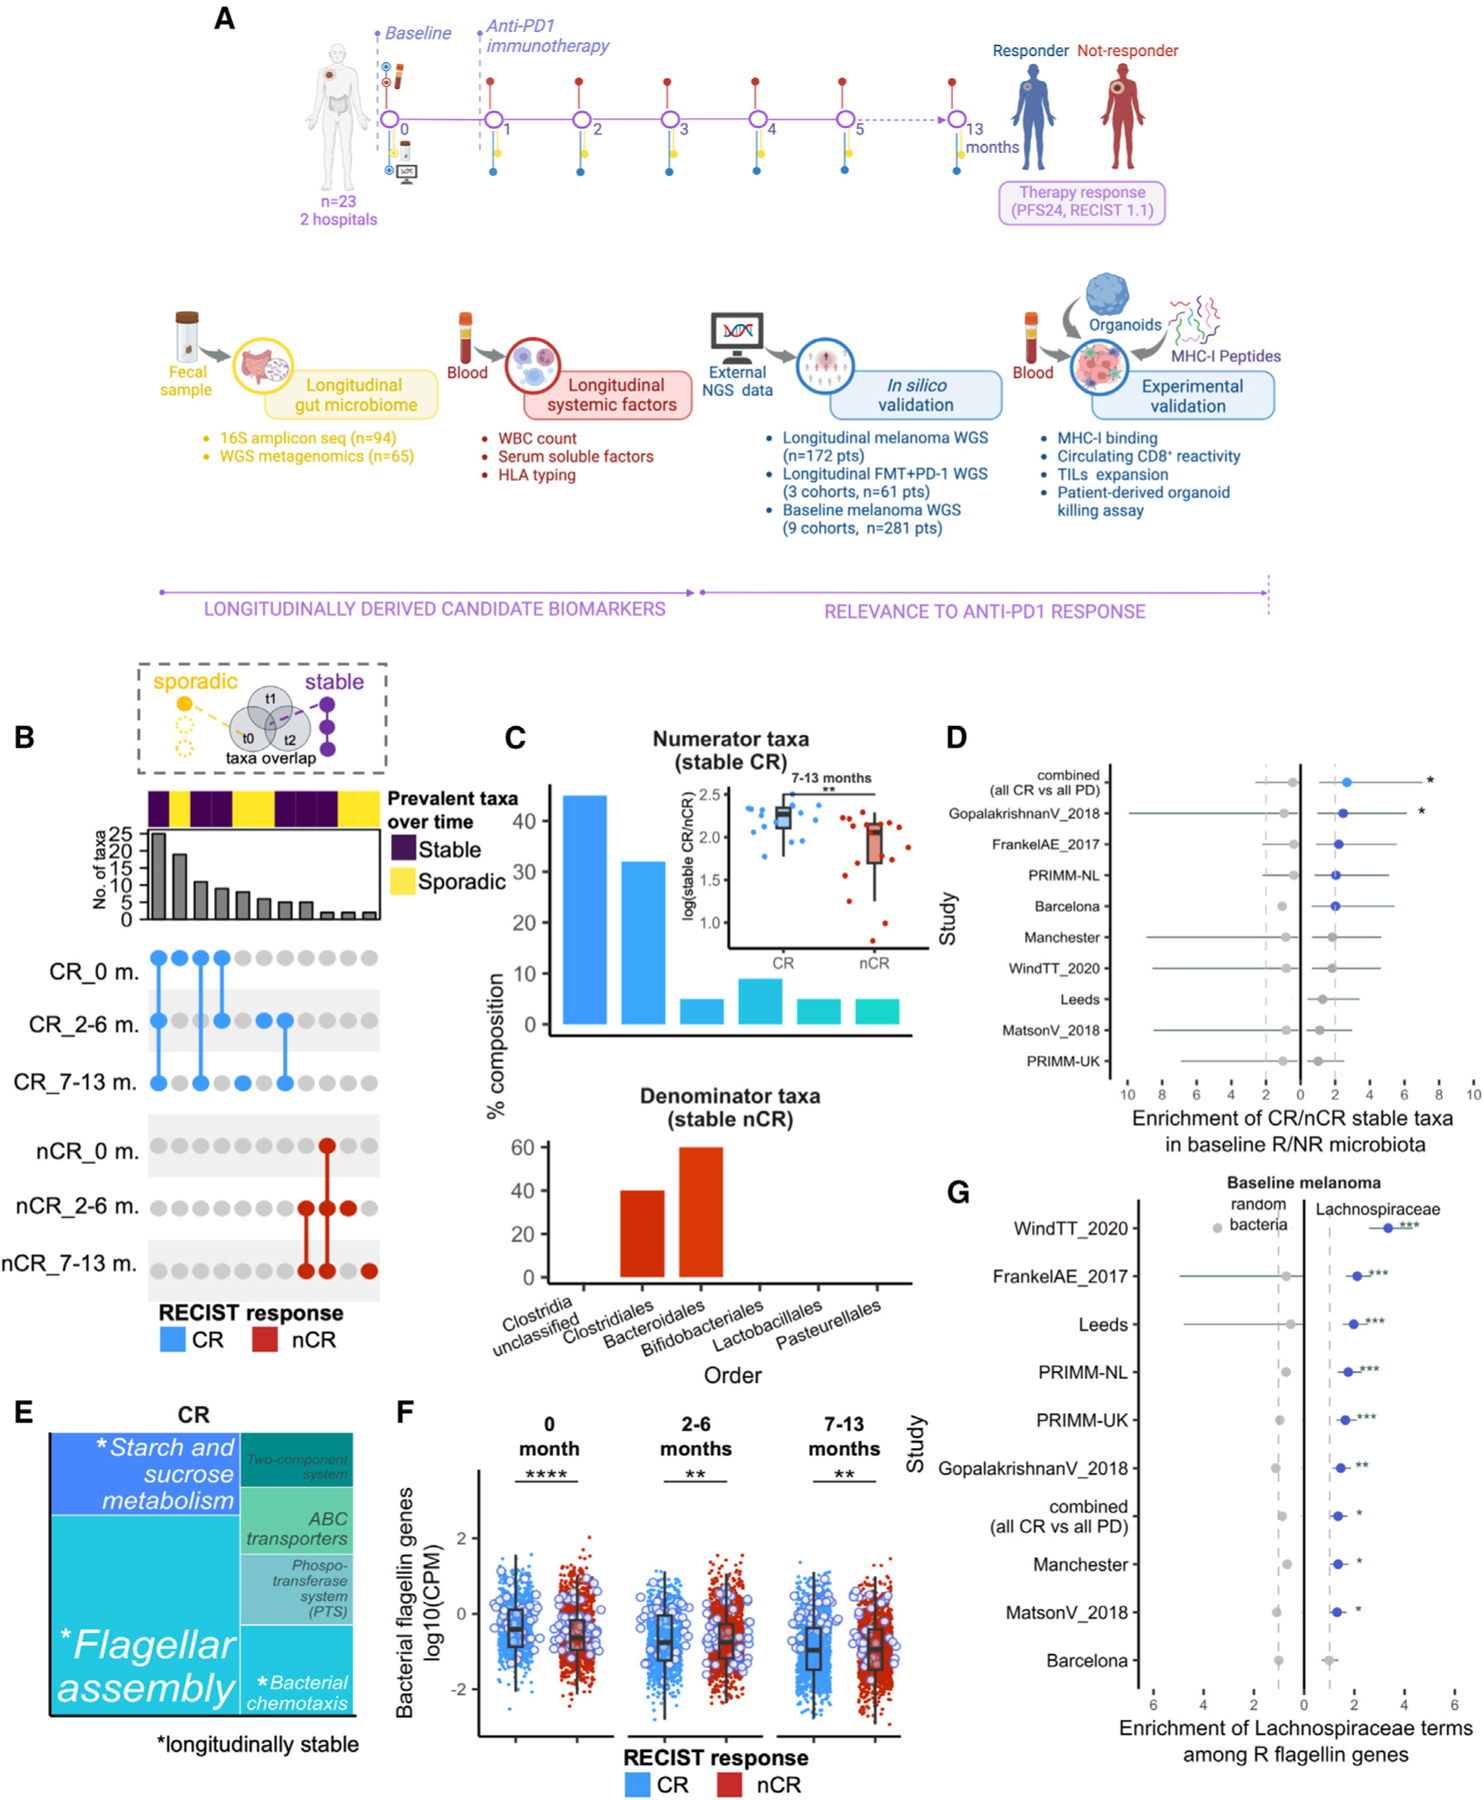
Figure 1. Longitudinally stable functions are enriched in the gut microbiome of patients with melanoma responsive to anti-PD-1 immunotherapy.

(A) Overview of study design. See also Figure S1A and Table S1.
(B) UpSet plot showing overlaps of prevalent taxa (present in >80% of samples) found in complete responder (CR) and non-CR (nCR) groups at 0, 2–6, and 7–13 months of therapy. Connected dots indicate prevalent taxa shared between time point groups (“stable”), whereas non-connected dots indicate prevalent taxa detected only in one time point group (“sporadic”). Plot is filtered to exclude taxa that have overlaps across CR and nCR (not group-specific). Stable CR is defined as prevalent taxa that are present across 0, 2–6, and 7–13 months, whereas stable nCR is defined as prevalent taxa that are present in at least two time point groups. See also Figures S1B–S1F.
(C) Order-level composition of stable CR (top) and nCR taxa (bottom) and the corresponding stable taxa measure in CR and nCR (i.e., log-ratio of their sum-aggregated relative abundances (inset). Asterisks indicate significance by Wilcoxon rank sum test. See also Figures S2A–S2D. For further biological correlations of stable taxa, see Figures S3 and S4.
(D) Baseline enrichment of stable CR and stable nCR taxa among R- and nR-prevalent taxa, respectively, across the indicated nine external melanoma cohorts. Dashed line indicates arbitrary cutoff for enrichment (Fisher’s exact test |OR|=2), line plots in blue indicate enrichment, line plots in gray indicate no enrichment, asterisks indicate significant enrichment at unadjusted p < 0.05 (Fisher’s exact test), and whiskers depict the interval for 95% confidence.
(E) Treemap of over-represented pathways in CR at p-adj < 0.05, based on KOs associated with CR across all samples (|LM coefficient| > 1.5). Terms in white indicate stable pathways, defined as over-represented pathways appearing at 0, 2–6, and 7–13 months (p-adj < 0.05) within CR, whereas terms in gray indicate non-stable pathways. See also Figures S5A–S5C and Table S3.
(F) Average gene family abundances (log10(CPM)) per patient of bacterial flagellin-related terms in CR and nCR, compared at 0, 2–6, and 7–13 months. Points outlined in blue indicate the top CR-associated flagellin genes by log2(fold-change). See also Figures S5D and S5E and Table S5.
(G) Baseline enrichment of Lachnospiraceae-associated terms among R-associated flagellin gene families across nine melanoma cohorts, dashed lines indicate arbitrary cutoff for enrichment in R (Fisher’s exact test |OR|>1), line plots to the left indicate enrichment of non-specific bacterial flagellin terms subsampled to the same size, line plots in gray indicate no enrichment, whiskers depict the interval for 95% confidence, and asterisks indicate significant enrichment at p-adj<0.05 (Fisher’s exact test). See also Tables S4 and S5.
Legend: with overlap (violet), spurious (yellow). CR (light blue), nCR (red). p-adj<0.001 (***), p-adj<0.01 (**), p-adj<0.05 (*), ns (unannotated).
