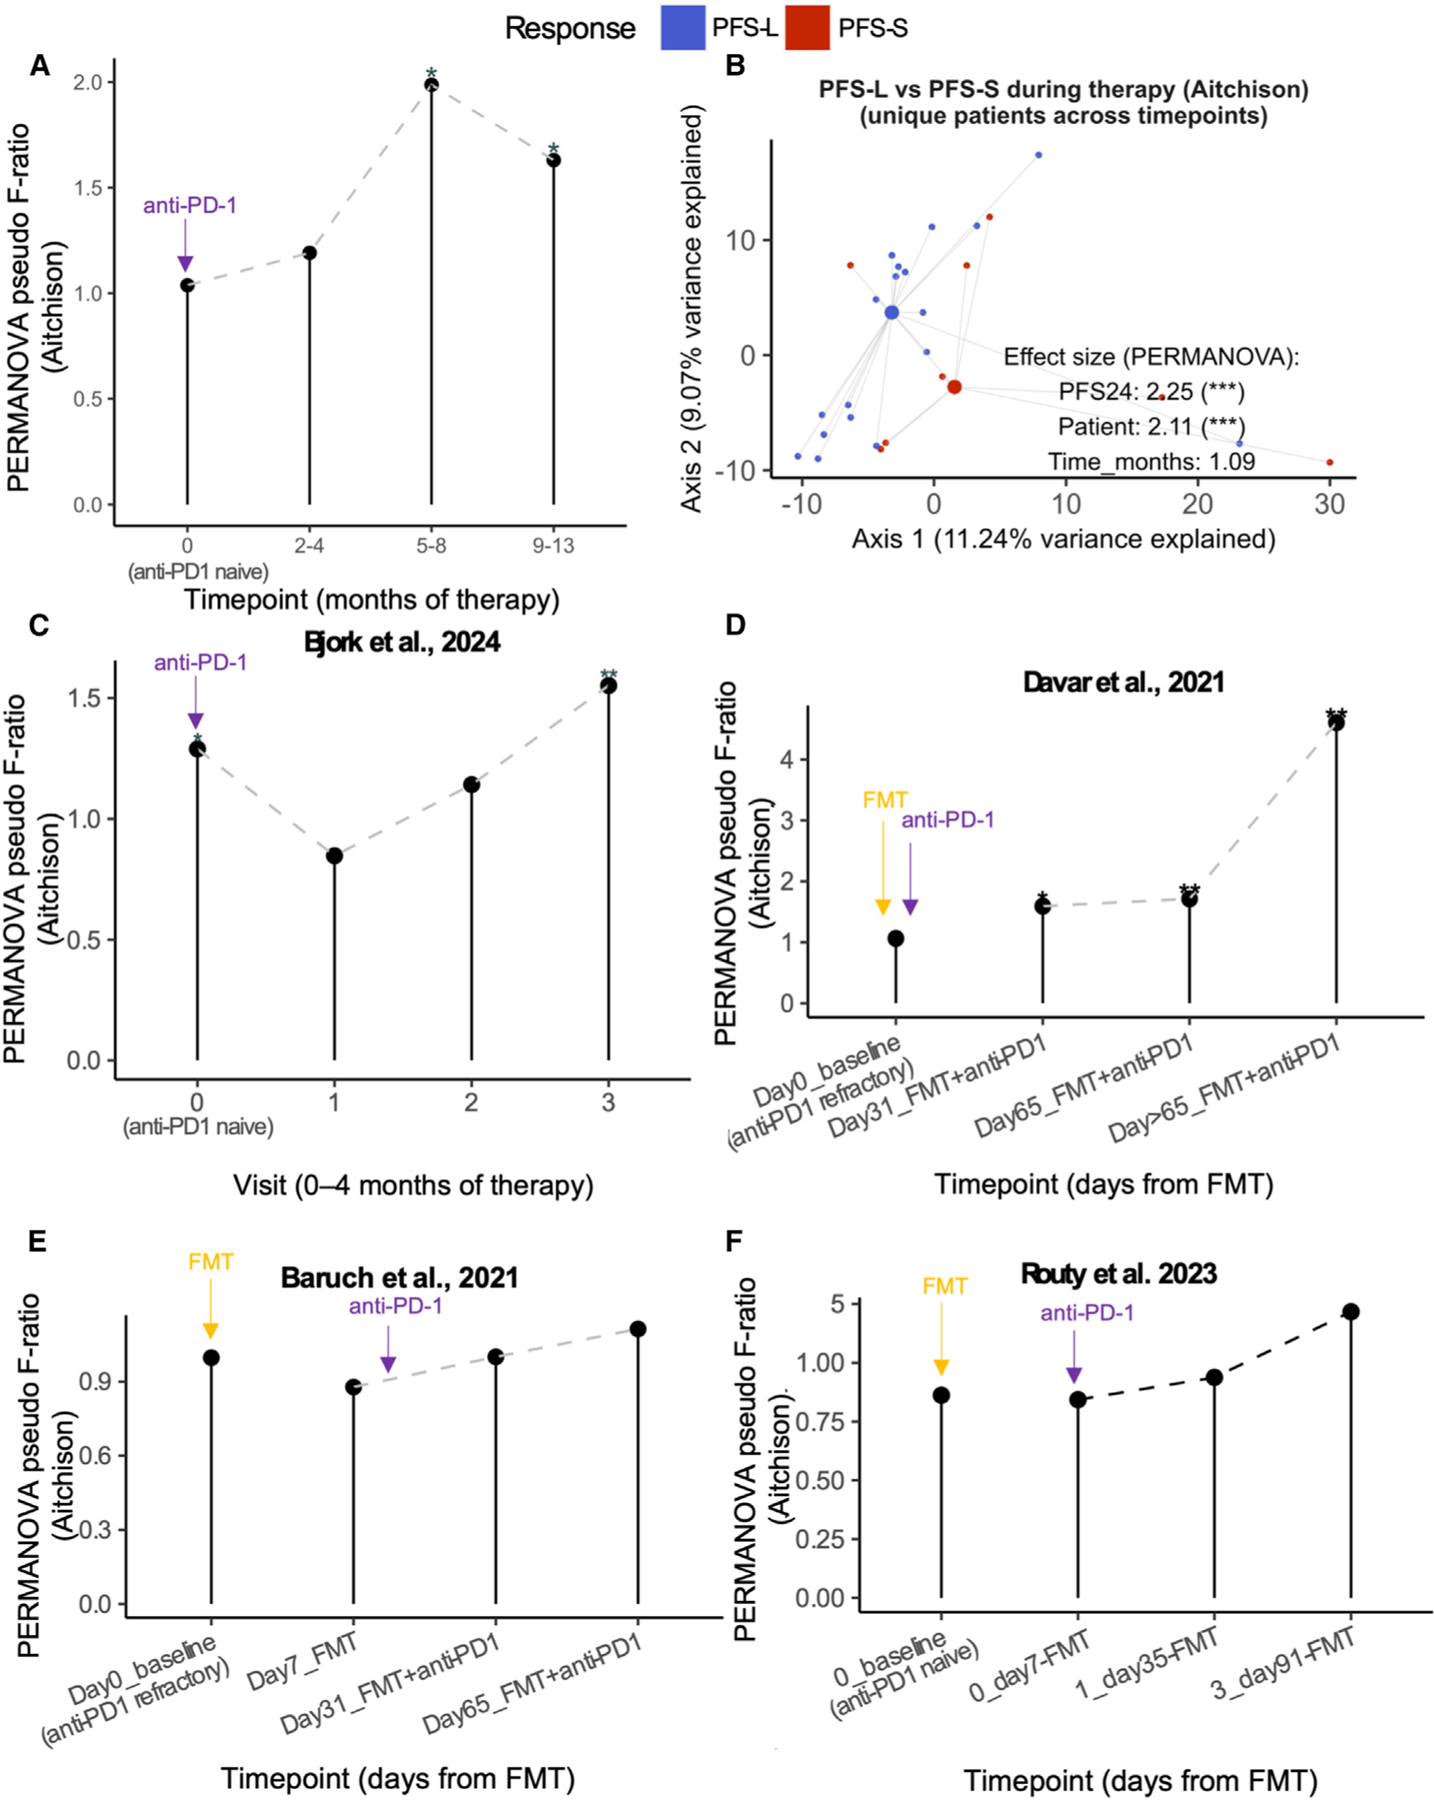
Figure 2. Patients with melanoma responding differently to anti-PD-1 therapy have progressively different gut microbiome diversity.

(A) Aitchison gut composition distance (PERMANOVA pseudo F-ratio) between PFS-L (PFS > 24 months) and PFS-S (PFS < 24 months) groups compared across time (0, 2–4, 5–8, and 9–13 months of therapy). Asterisk indicates PERMANOVA p-adj (distance~Response) at the given time point group. See also Table S1 and Figure S6A.
(B) PCA plot of PFS-L and PFS-S Aitchison beta diversity using randomly sampled unique patient samples at each time point group during therapy (2–4, 5–8, and 9–13 months). Statistics are from multi-variate PERMANOVA (distance~Response+Patient+Time point). See also Figure S6B. For similar analyses on 16S data, see Figures S5C–S5G. For comparison against tumor-free, see Figures S7A–S7C and Table S2.
(C–F) Aitchison gut composition difference between R and nR from Shotgun sequencing of (C) longitudinal melanoma-ICI study by Bjork et al.16, compared at visits 0, 1, 2, and 3, spanning 0 to 1–4 months of therapy, depending on patient. Cutoff of < 4 months of therapy was set for this analysis based on sample size distribution across time points of this study, and FMT melanoma-ICI studies by (D) Davar et al., 2021,10 (E) Baruch et al.,24 and (F) Routy et al.13 and compared at different time points as indicated. Asterisk indicates PERMANOVA p-adj (distance~group) at the given time point group. Arrows indicate time point at which fecal microbiota transplant (FMT, yellow) and/or anti-PD1 immunotherapy (violet) commenced for that study. Differences among these studies are outlined in detail in Table S8.
Legend: PFS-L (blue), PFS-S (red). p-adj<0.001 (***), p-adj<0.01 (**), p-adj<0.05 (*), ns (unannotated).
