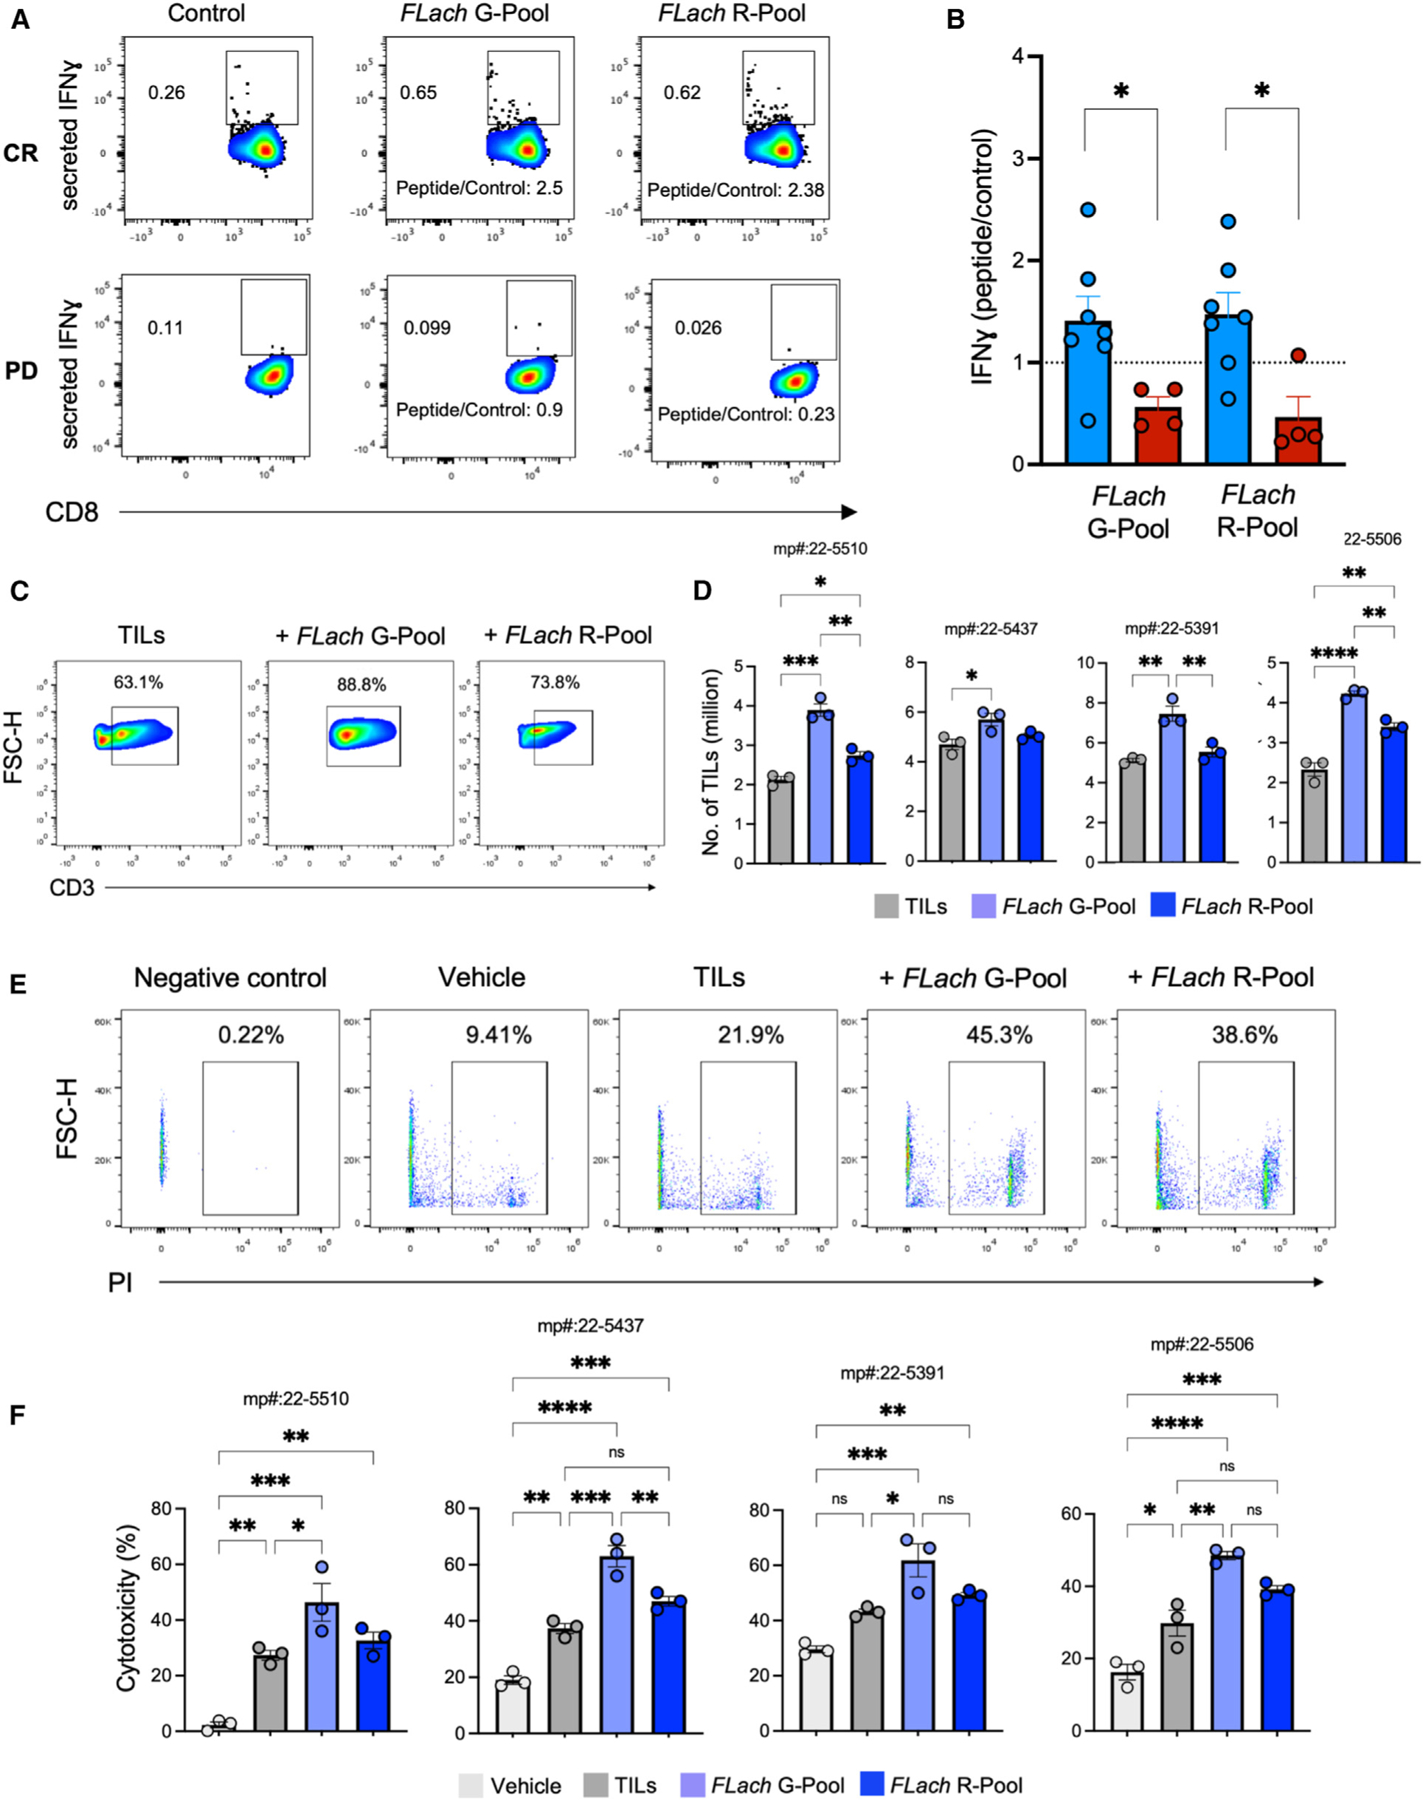
Figure 4. Complete response associates with a higher FLach-directed reactivity and antitumor immunity in melanoma patients.

(A and B) (A) Representative flow cytometry contour plots and (B) MFI measurements of IFN-γ (normalized on untreated controls) on CD8+ T cells in peripheral blood monocytic cells (PBMCs) from patients with melanoma grouped by response to ICI (responsive = 7, non-responsive = 4). See also Figures S8B–S8E and Table S7.
(C and D) (C) Representative flow cytometry contour plots and (D) number of TILs from four human melanoma tumors expanded with or without adding the indicated peptide pools. See also Figure S8F.
(E and F) (E) Flow cytometry and (F) bar plots showing cytotoxicity (measured as % of PI-positive melanoma cells) of TILs expanded with or without adding the indicated peptide pools and tested on four matching melanoma patient-derived organoids.
