Figure 1.
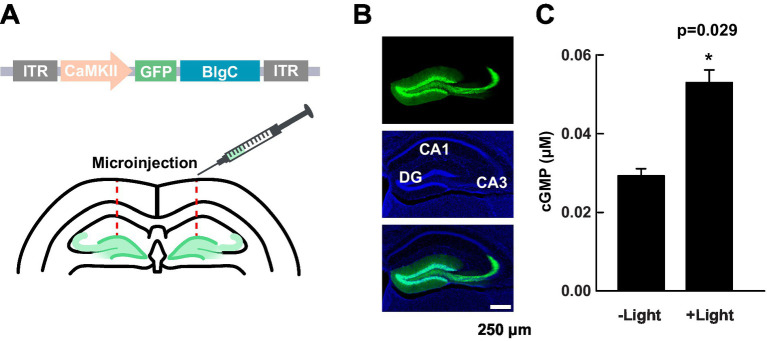
Expression and validation of BlgC in DG neurons. (A) Schematic of the transfer plasmid components within the inverted terminal repeats (ITR); mice received bilateral DG injections of AAV1-CaMKIIα promoter-GFP-BlgC. (B) A representative image of the distribution of GFP-BlgC in hippocampal slices. GFP fluorescence (green, upper), DAPI staining (blue, middle), and merged (lower) images collected by a confocal microscope. (C) Measurement of cGMP in hippocampal slice lysate by ELISA following either photoactivation (+Light) of BlgC or no (−) light control. The illumination was carried out by 455 nm LED (4.5 mW/mm2 for 5 min, n = 3, unpaired t-test). Data are presented as mean ± SEM.

