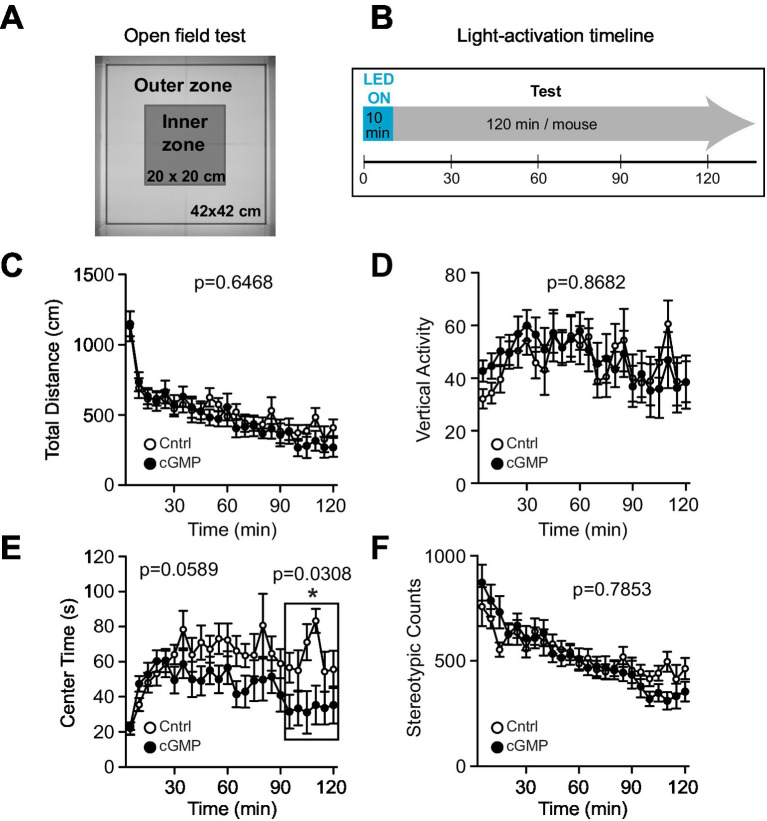
Figure 4.
Open Field (OF) test. (A) Schematic of OF test. (B) Light (or mock) activation timeline during OF test. (C-F) Control (Cntrl) and photostimulated BlgC (cGMP) mice showed no significant differences in the total distance travelled (C), Vertical activity (D), Center time (E) and Stereotypic counts (F). During the last 30 min of the OF test, cGMP mice spent significantly less time in the center of the arena compared with control (Cntrl) mice (E, in the frame). Cntrl n = 10, cGMP n = 13. Data are mean ± SEM. Statistical analysis was performed using a two-way repeated measures ANOVA.

