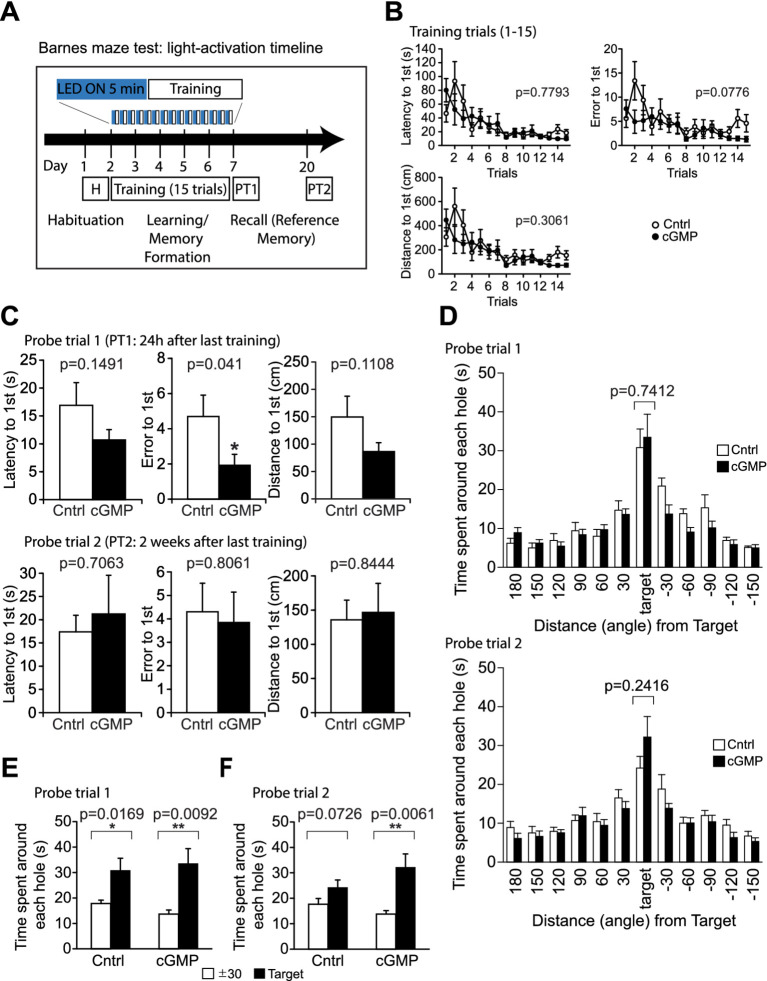
Figure 6.
Barnes Maze (BM) test. (A) Schematic of light (or mock) activation timeline during BM test. During trials 1–15, mice are trained to learn the location of the escape box; learning is measured as latency(s), distance travelled (cm) and error to target hole. (B) DG cGMP mice did not show significant differences in the latency, error and distance to find the escape hole in the training session. (C, D) In probe test 1 (PT1), DG cGMP mice show a significantly lower error, but no significant differences in the time spent around the target escape hole. In probe test 2 (PT2), cGMP mice did not show any differences in the latency, error or distance to find the escape hole, and the time spent around the target escape hole. (E-F) 24 h (E) and 2 weeks (F) after the last training trial, mice were subjected to the probe tests (PT1 and PT2, respectively) and allowed to explore the arena for 3 min with the escape box removed. Total time spent around each hole was recorded. Cntrl n = 10, cGMP n = 13. Data are mean ± SEM. Statistical analysis was performed using a two-way repeated ANOVA (training session: B), and an unpaired t-test (C, D) and a paired t-test (E, F).

