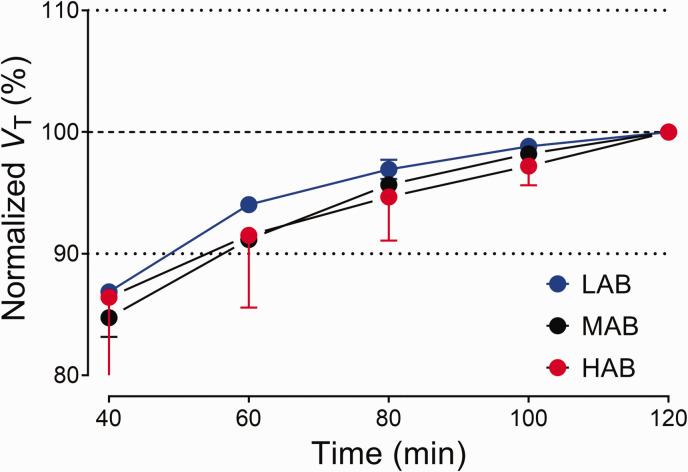
Figure 4.
Time-stability analysis of regional total distribution volume (VT) for [18F]SF51. VT was estimated via two-tissue compartment modeling and normalized to the terminal VT value at 120 minutes. Symbols and error bars represent the mean and SD (n = 3 for mixed-affinity binders (MABs); n = 2 for high-affinity binders (HABs) and low-affinity binders (LABs)).

