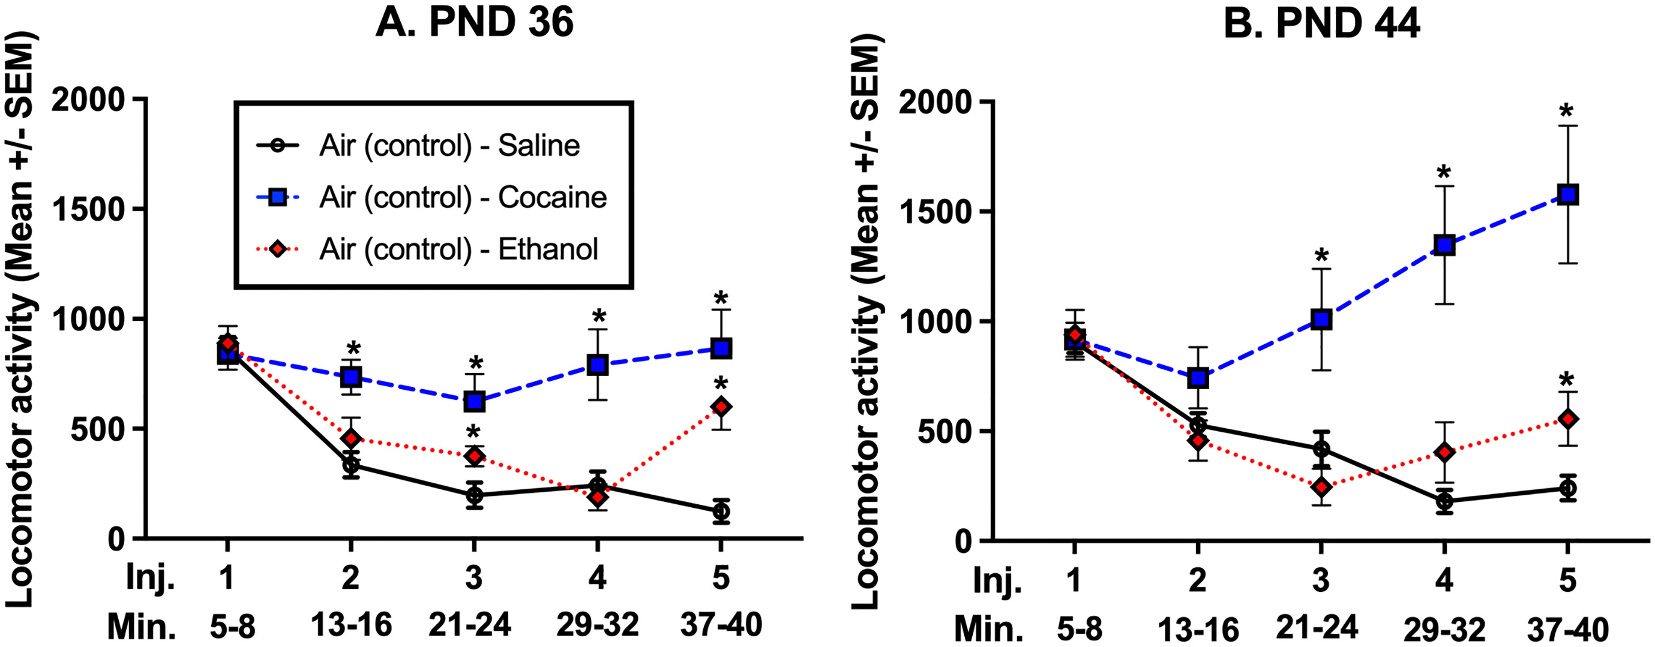
Fig. 3.

Comparison of drug effect in air-control groups only.
Experiment 2: Cumulative Dose Response Exclusively Air-control groups LMA: To show drug effects for the CDR design, only groups that were exposed to Air-control during the prior phase are included in these graphs. Panel A depicts mice tested at PN36, while Panel B depicts mice tested at PND 44. The lines represent challenge drugs with saline (black), cocaine (blue), and ethanol (red). The “*” symbol indicates a statistically significant difference (p < 0.05) from mice administered saline during the CDR. (For interpretation of the references to colour in this figure legend, the reader is referred to the web version of this article.)
