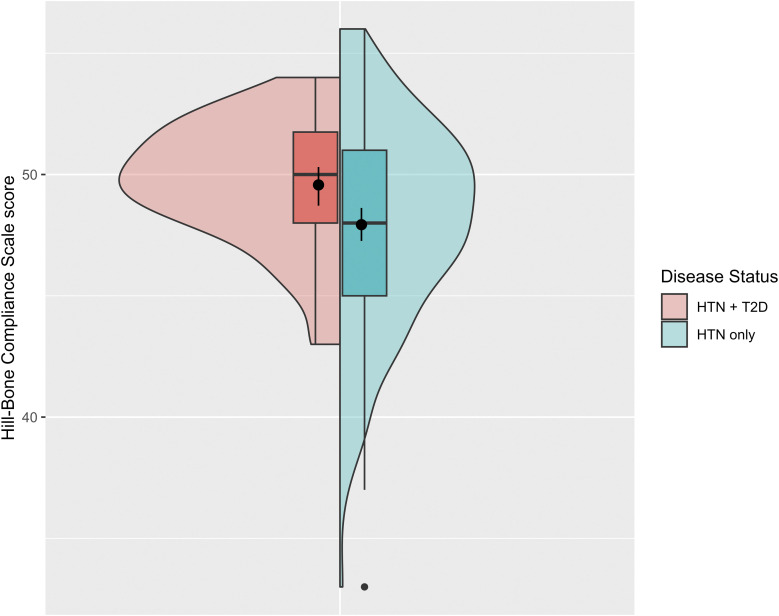
Figure 1.
Hill-Bone Compliance scale scores by disease status. Mean Hill-Bone Score was higher in those with hypertension (HTN) and type 2 diabetes (T2D) when compared to those with only hypertension (49.6 vs. 47.9 points, respectively). There was also more variability in the HTN only group (range of scores from 33 to 56 points) when compared to the HTN + T2D group (range of scores from 43 to 54 points). We displayed boxplots and overlaid density plots for each group. We also plotted mean scores and corresponding 95% confidence intervals with a filled circle and vertical line for each group.

