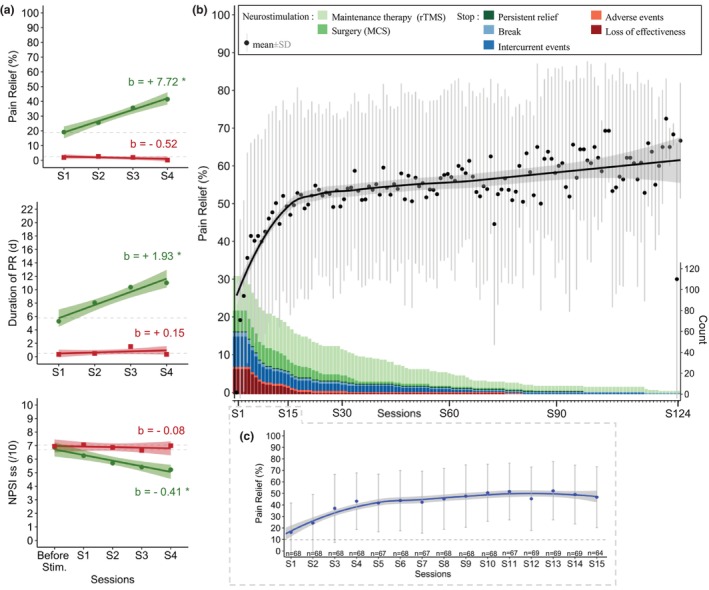
FIGURE 2.

(a) Time course of outcomes (PR, DPR and ssNPSI) during the test period in the whole population according to status after the 4th session (responders: Green dot, and non‐responders: Red square). Regression lines (with 95% confidence intervals) and coefficients (b) obtained from linear mixed models (including a random intercept for each patient) with sessions as repeated measures factor. *indicates significant test for regression coefficients (p < 0.05). Note that responders (PR≥10%, n = 113) and non‐responders (PR < 10%, n = 80) did not differ at baseline in the ssNPSI (LMMs results; 6.69[6.14;7.25] vs. 7.04[6.52;7.57], p = 0.38) (b) Time course of percentage of pain relief over 124 sessions in responders (n = 113) and sample size of responders per session. The black line indicates smooth conditional means (with 95% confidence interval) of PR over 124 sessions and black dots are averages (±sd on grey) for each session. The sample size progressively decreases over time and the reasons for session discontinuation are detailed with colour bars. Note a progressive increase of PR during the first year (first 15th sessions) which may be due to the disappearance of ephemeral responders (patients who discontinued rTMS due to loss of efficacy) or to a real cumulative effect. (c) Time course of percentage of pain relief in responders who had received at least 15 sessions (n = 69). The blue line indicates smooth conditional means (with 95% confidence interval) of PR over the first 15 sessions and blue dots are averages (±sd on grey) for each session. Note a cumulative effect, reaching a saturation after the 6th session, at around 50% PR.
