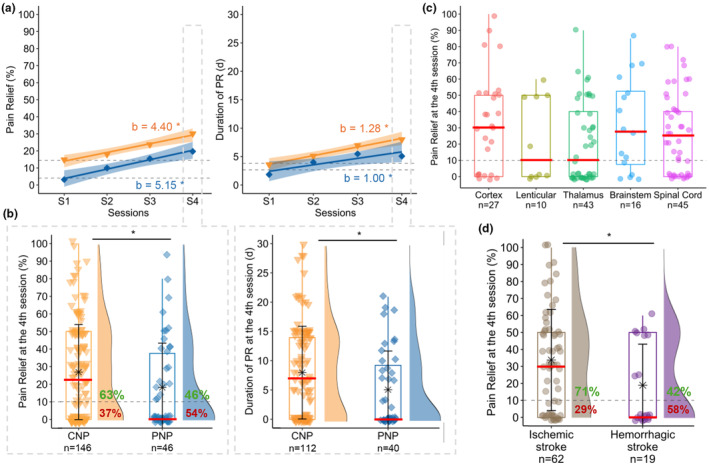
FIGURE 4.

(a) Time course of percentage and duration of pain relief during the test period in the whole population according to aetiology (CNP: Central neuropathic pain in orange triangle, PNP: Peripheral neuropathic pain in blue diamond). Regression lines (with 95% confidence intervals) and coefficients (b) obtained from linear mixed models (including a random intercept for each patient) with sessions as repeated measures factor. *indicates a significant test for regression coefficients (p < 0.05). No significant difference was found in the regression coefficients of PR and DPR between CNP and PNP. (b) Comparison of percentage and duration of pain relief at the 4th session between CNP (on left) and PNP (on right). Boxplots and density plots show the distribution of individual data within each group. Means ± standard deviations are depicted as stars with error bars. Medians are represented by red lines. On density diagrams, we can see the percentage of responders (≥10% PR) in CNP (=63%) and PNP (=46%). *indicates a significant difference between the 2 groups (p < 0.05). (c) Distribution of percentage of PR at the 4th session according to five levels of lesion (cortex, lenticular, thalamus, brainstem, spinal cord) in patients with central NP. (d) Distribution of percentage of PR at the 4th session according to the type of the stroke (i.e. ischemic and hemorrhagic) in patients with central NP. *indicates a significant difference between the 2 groups (p < 0.05).
